. 2008 Jul 29;105(30):10607-12.
doi: 10.1073/pnas.0804110105. Epub 2008 Jul 18.

High-field fMRI unveils orientation columns in humans

Affiliations

High-field fMRI unveils orientation columns in humans

Essa Yacoub et al. Proc Natl Acad Sci U S A. .

Abstract

Functional (f)MRI has revolutionized the field of human brain research. fMRI can noninvasively map the spatial architecture of brain function via localized increases in blood flow after sensory or cognitive stimulation. Recent advances in fMRI have led to enhanced sensitivity and spatial accuracy of the measured signals, indicating the possibility of detecting small neuronal ensembles that constitute fundamental computational units in the brain, such as cortical columns. Orientation columns in visual cortex are perhaps the best known example of such a functional organization in the brain. They cannot be discerned via anatomical characteristics, as with ocular dominance columns. Instead, the elucidation of their organization requires functional imaging methods. However, because of insufficient sensitivity, spatial accuracy, and image resolution of the available mapping techniques, thus far, they have not been detected in humans. Here, we demonstrate, by using high-field (7-T) fMRI, the existence and spatial features of orientation- selective columns in humans. Striking similarities were found with the known spatial features of these columns in monkeys. In addition, we found that a larger number of orientation columns are devoted to processing orientations around 90 degrees (vertical stimuli with horizontal motion), whereas relatively similar fMRI signal changes were observed across any given active column. With the current proliferation of high-field MRI systems and constant evolution of fMRI techniques, this study heralds the exciting prospect of exploring unmapped and/or unknown columnar level functional organizations in the human brain.


Conflict of interest statement

The authors declare no conflict of interest.

Figures
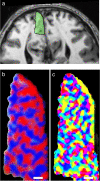
Fig. 1.
Fig. 1.
Slice selection and functional domains in human visual cortex. a depicts the optimal region of flat gray matter in primary visual cortex (parallel to the calcarine sulcus) in one subject from which columnar level fMRI maps of ODC (b) and orientation preference (c) are generated and characterized. The functional maps in b and c are zoomed views of the ROI in a. The red and blue colors in b indicate preferences to right or left eye stimulation, whereas the color distribution in c represents a given voxel's fMRI time course phase, which is indicative of its preferred stimulus orientation. (Scale bar: 1.0 mm.)
Fig. 2.
Fig. 2.
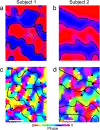
Ocular dominance and orientation columns in human visual cortex. Shown in a and b are additionally zoomed ODC maps from the image in Fig. 1b (subject 1) and from another subject (subject 2), respectively. Red and blue represent voxels that demonstrated preference to right and left eye stimulation, respectively. fMRI maps in c and d depict the orientation preference maps from the same cortical areas as their corresponding ODC maps in a and b, respectively. ODC borders are marked with solid black lines on both the ODC and orientation maps. The black and white circles on the orientation preference maps represent areas where multiple preferences converge, or the so called pinwheel centers. This radial arrangement can be either CW (white) or CCW (black). (Color bar: calculated phase at the stimulus frequency; scale bar: 0.5 mm.)
Fig. 3.
Fig. 3.
Spatial features of fMRI maps of orientation preference in human visual cortex. Orientation preference was determined by the temporal phase of fMRI signal changes at the stimulus frequency. The solid black lines indicate the ODC borders. The black or white circles represent singularity points or the centers of the observed radially arranged orientation preference. This radial arrangement can be either CW (white) or CCW (black). Linear zones are regions where the orientation preference changes linearly and tends to extend orthogonally across ODC borders. (Scale bar: 0.5 mm.)
Fig. 4.
Fig. 4.
Reproducibility of orientation preference maps. To test the reproducibility of the phase maps, the displayed orientations were presented through a CW (a) or CCW (b) rotation while an identical phase-encoding analysis was preformed. At a time point corresponding to a quarter of the cycle, voxels seeing a 45° stimulus during a CW rotation will see a 135° stimulus during a CCW rotation, as schematically illustrated in d. Thus, the CW and CCW phase maps should reflect a 180° shift (i.e., complementary maps). For qualitative demonstration, the CW and CCW phase maps (from subject 2) were binned into a 90° bandwidth (a and b, respectively); bright regions in the CW map were outlined (red) and superimposed on the CCW map. Bright regions in the CW map largely overlap with regions of dark colors in the CCW maps (b). Furthermore, good reproducibility is seen with maps acquired on different days (c). (Scale bar: 0.5 mm.)
Fig. 5.
Fig. 5.
Quantification of preferred orientation. Column groups in this analysis are defined as those voxels with preferred orientations within ±15 around 0°, 45°, 90°, or 135° orientations. (a) Histograms of the number of voxels within each preferred orientation group for each subject. For both subjects, a statistically significant (Psubject1 < 0.03, Psubject2 < 0.07) larger number of voxels were tuned to 90° orientations. (b) Normalized fMRI signal amplitude changes for each group of orientations, averaged over both subjects. The error bars in a represent errors between scans within the same subject, and the asterisks represent the significance of the difference between the number of voxels at a given orientation vs. the number of voxels at 90°.
Fig. 6.
Fig. 6.
Effect of the PSF on column mapping. a illustrates the intensity distribution that would be measured from a 1D response to a single stimulus that elicits a signal intensity increase of 1 between 2 and 3 mm and 0 everywhere else (blue line) when sampled with a function with a Gaussian PSF (full-width half-maxima) of 0.7, 1.6, and 2 mm. The response is equivalent to what would be seen in “single-condition” mapping of a single-element “column”. b shows the plots of the case when there are two such responses between 2 and 3 mm and between 3 and 4 mm for two different stimuli and when these responses are mapped as a difference (i.e., as in differential imaging). c shows the results when there are repeated alternating responses to the two different stimuli and when the response is imaged as a difference for the three different PSFs. In this case, the alternating columnar structure extended beyond 0 (in the negative direction) and 8 mm in the positive direction but only the 0- to 8-mm region is illustrated to avoid the edge effects.

References

    1. Vaughan JT, et al. 7T vs. 4T: RF power, homogeneity, and signal-to-noise comparison in head images. Magn Reson Med. 2001;46:24–30. - PubMed
    1. Ugurbil K, et al. Ultrahigh field magnetic resonance imaging and spectroscopy. Magn Reson Imaging. 2003;21:1263–1281. - PubMed
    1. Lorente de No' R. Architectonics and structure of the cerebral cortex. In: Fulton JF, editor. Physiology of the Nervous System. New York: Oxford Univ Press; 1938. pp. 291–330.
    1. Mountcastle VB. Modality and topographic properties of single neurons of cat's somatic sensory cortex. J Neurophysiol. 1957;20:408–434. - PubMed
    1. Woolsey TA, Van der Loos H. The structural organization of layer IV in the somatosensory region (SI) of mouse cerebral cortex. The description of a cortical field composed of discrete cytoarchitectonic units. Brain Res. 1970;17:205–242. - PubMed

Publication types