

Low- versus high-baseline epinephrine output shapes opposite innate cytokine profiles: presence of Lewis- and Fischer-like neurohormonal immune phenotypes in humans?
- PMID: 18641310
- PMCID: PMC10066863
- DOI: 10.4049/jimmunol.181.3.1737
Low- versus high-baseline epinephrine output shapes opposite innate cytokine profiles: presence of Lewis- and Fischer-like neurohormonal immune phenotypes in humans?
Abstract
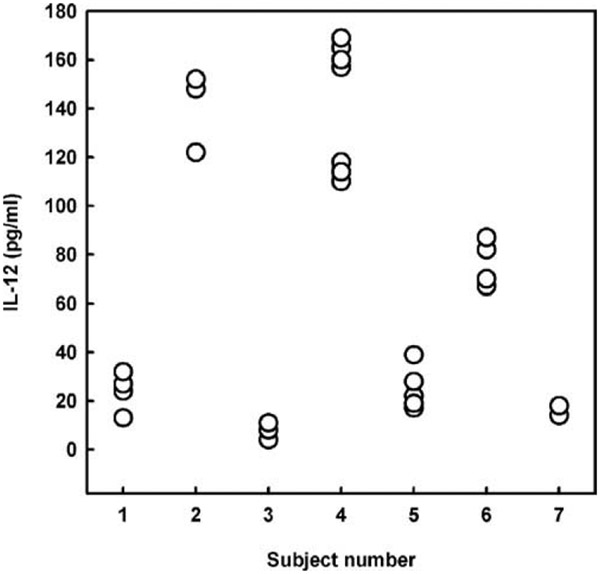
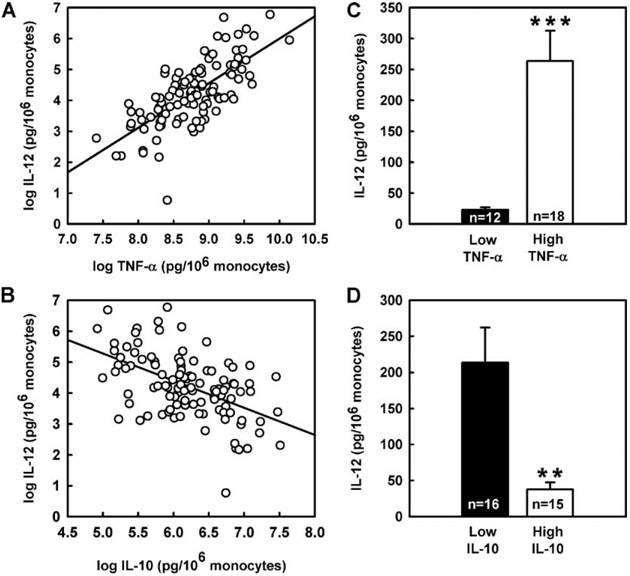
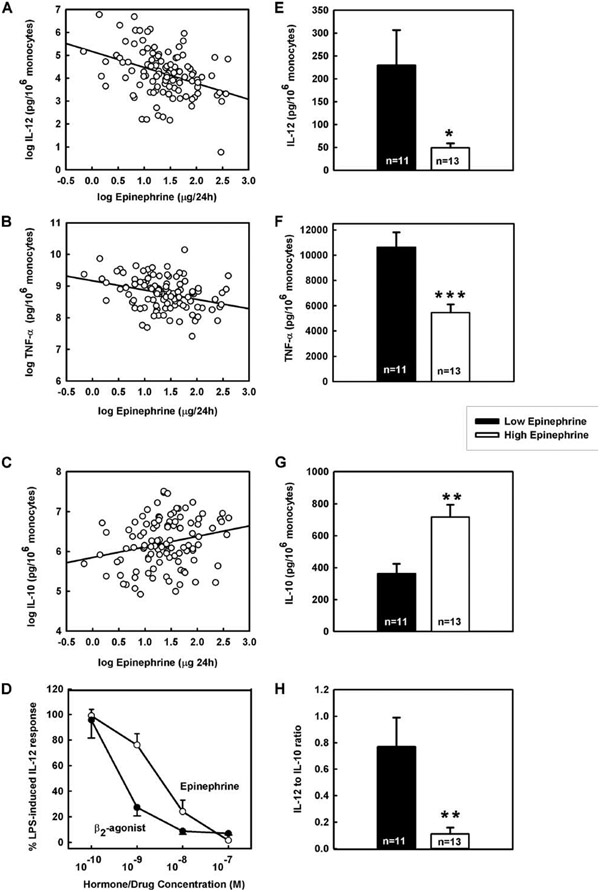
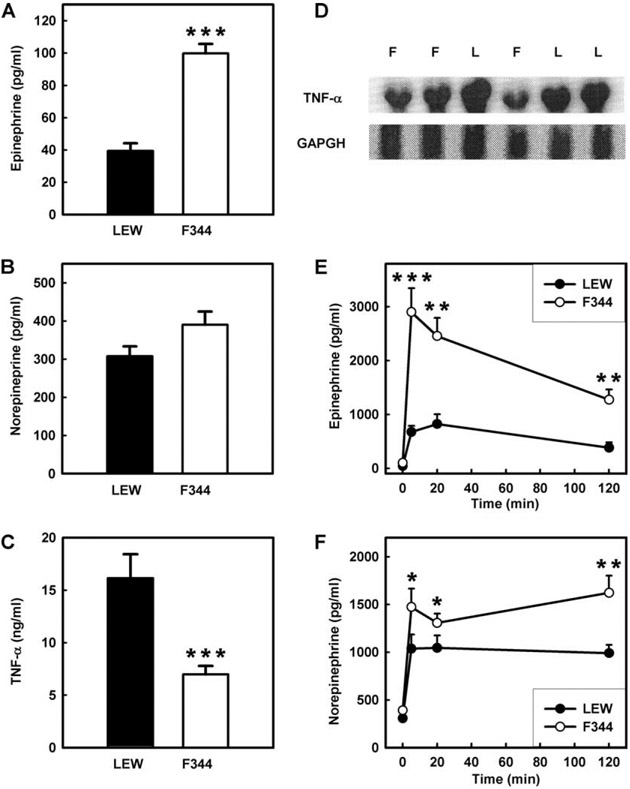
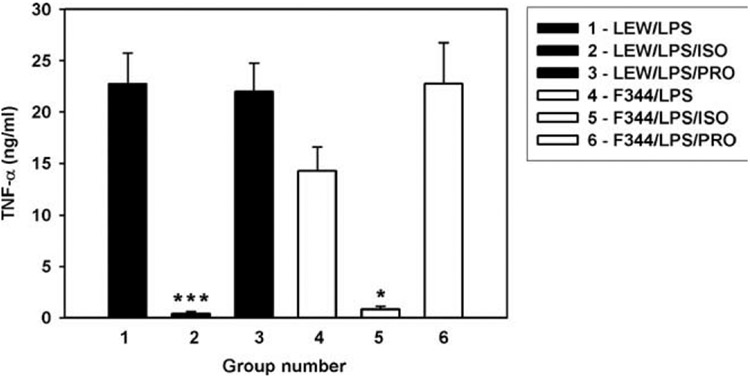
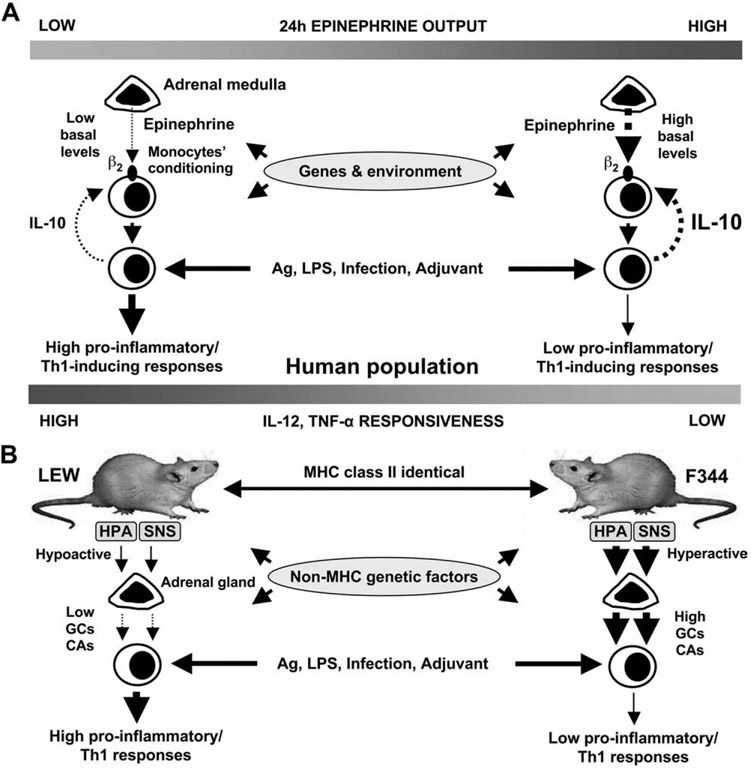
Immunogenetic mechanisms operating within the immune system are known to influence cytokine profiles and disease susceptibility. Yet the role of the individual's neurohormonal background in these processes remains undefined. Hormonal imbalances are documented in immune-related diseases, but it is unclear whether this represents a secondary phenomenon or a primary "defect" related to specific neurohormonal immune phenotype(s). We report that in a large subpopulation of healthy humans the baseline epinephrine output (but not cortisol and sex steroid hormones) correlated inversely with proinflammatory and positively with anti-inflammatory cytokine production. Thus, low vs high epinephrine excretors had a 2- to 5-fold higher TNF-alpha and IL-12 production but 2-fold lower IL-10 production induced by LPS ex vivo. In alternative settings, we found low baseline levels and profoundly blunted stress-induced epinephrine responses but high TNF-alpha levels in Lewis vs Fischer inbred rats. Additionally, isoproterenol, a beta adrenoreceptor agonist suppressed LPS-induced TNF-alpha production, with more pronounced effect in Lewis than in Fischer rats. In human monocytes, epinephrine and the beta(2) adrenoreceptor agonist fenoterol potently inhibited LPS-induced TNF-alpha and IL-12, but stimulated IL-10 production. The order of potency for hormones able to inhibit IL-12 production ex vivo was: epinephrine > norepinephrine > or = 1,25-(OH)(2) vitamin D(3) > hydrocortisone. This indicates that baseline epinephrine conditions cytokine responsiveness and through this mechanism intrinsic hypo- or hyperactive adrenal medullas in some individuals may shape opposite cytokine profiles. Since Lewis and Fischer rats have opposite susceptibility to experimental immunological diseases, this suggests that the parallel human phenotypes could be linked to differing responsiveness and susceptibility to infections and immune/inflammatory-related conditions.
Conflict of interest statement
Disclosures
The authors have no financial conflict of interest.
Figures
Similar articles
-
Evaluation of in vivo cytokine expression in EAU-susceptible and resistant rats: a role for IL-10 in resistance?Exp Eye Res. 2000 Apr;70(4):493-502. doi: 10.1006/exer.1999.0808. Exp Eye Res. 2000. PMID: 10865998
-
Inflammation and exercise: Inhibition of monocytic intracellular TNF production by acute exercise via β2-adrenergic activation.Brain Behav Immun. 2017 Mar;61:60-68. doi: 10.1016/j.bbi.2016.12.017. Epub 2016 Dec 21. Brain Behav Immun. 2017. PMID: 28011264 Free PMC article.
-
Differential modulation of innate immune response by epinephrine and estradiol.Horm Mol Biol Clin Investig. 2017 May 5;30(3):/j/hmbci.2017.30.issue-3/hmbci-2016-0046/hmbci-2016-0046.xml. doi: 10.1515/hmbci-2016-0046. Horm Mol Biol Clin Investig. 2017. PMID: 28475489
-
Stress system activity, innate and T helper cytokines, and susceptibility to immune-related diseases.Ann N Y Acad Sci. 2006 Jun;1069:62-76. doi: 10.1196/annals.1351.006. Ann N Y Acad Sci. 2006. PMID: 16855135 Review.
-
The sympathetic nerve--an integrative interface between two supersystems: the brain and the immune system.Pharmacol Rev. 2000 Dec;52(4):595-638. Pharmacol Rev. 2000. PMID: 11121511 Review.
Cited by
-
Effect of cold stress on immunity in rats.Exp Ther Med. 2016 Jan;11(1):33-42. doi: 10.3892/etm.2015.2854. Epub 2015 Nov 11. Exp Ther Med. 2016. PMID: 26889214 Free PMC article.
-
The immunomodulatory mechanism of dexmedetomidine.Int Immunopharmacol. 2021 Aug;97:107709. doi: 10.1016/j.intimp.2021.107709. Epub 2021 Apr 29. Int Immunopharmacol. 2021. PMID: 33933842 Free PMC article. Review.
-
Sleep and immune function.Pflugers Arch. 2012 Jan;463(1):121-37. doi: 10.1007/s00424-011-1044-0. Epub 2011 Nov 10. Pflugers Arch. 2012. PMID: 22071480 Free PMC article. Review.
-
Fischer 344 and Lewis Rat Strains as a Model of Genetic Vulnerability to Drug Addiction.Front Neurosci. 2016 Feb 9;10:13. doi: 10.3389/fnins.2016.00013. eCollection 2016. Front Neurosci. 2016. PMID: 26903787 Free PMC article. Review.
-
Sleep and Immune System Crosstalk: Implications for Inflammatory Homeostasis and Disease Pathogenesis.Ann Neurosci. 2024 Sep 20;32(3):196-206. doi: 10.1177/09727531241275347. eCollection 2025 Jul. Ann Neurosci. 2024. PMID: 39544655 Free PMC article. Review.
References
-
- Molvig J, Baek L, Christensen P, Manogue KR, Vlassara H, Platz P, Nielsen LS, Svejgaard A, and Nerup J. 1988. Endotoxin-stimulated human monocyte secretion of interleukin 1, tumour necrosis factor α, and prostaglandin E2 shows stable interindividual differences. Scand. J. Immunol 27: 705–716. - PubMed
-
- de Groote D, Zangerle PF, Gevaert Y, Fassotte MF, Beguin Y, Noizat-Pirenne F, Pirenne J, Gathy R, Lopez M, and Dehart I. 1992. Direct stimulation of cytokines (IL-1β, TNF-α, IL-6, IL-2, IFN-γ, and GM-CSF) in whole blood: I. Comparison with isolated PBMC stimulation. Cytokine 4: 239–248. - PubMed
-
- Entzian P, Linnemann K, Schlaak M, and Zabel P. 1996. Obstructive sleep apnea syndrome and circadian rhythms of hormones and cytokines. Am. J. Respir. Crit Care Med 153: 1080–1086. - PubMed
-
- Westendorp RG, Langermans JA, Huizinga TW, Elouali AH,Verweij CL, Boomsma DI, Vandenbroucke JP, and Vandenbrouke JP. 1997. Genetic influence on cytokine production and fatal meningococcal disease. Lancet 349: 170–173. - PubMed
-
- Frucht DM, and Holland SM. 1996. Defective monocyte costimulation for IFN-γ production in familial disseminated Mycobacterium avium complex infection: abnormal IL-12 regulation. J. Immunol 157: 411–416. - PubMed
MeSH terms
Substances
Grants and funding
LinkOut - more resources
Full Text Sources
