. 2008 Aug 1;181(3):1835-48.
doi: 10.4049/jimmunol.181.3.1835.

Functional regulatory T cells accumulate in aged hosts and promote chronic infectious disease reactivation

Affiliations

Functional regulatory T cells accumulate in aged hosts and promote chronic infectious disease reactivation

Celine S Lages et al. J Immunol. .

Abstract

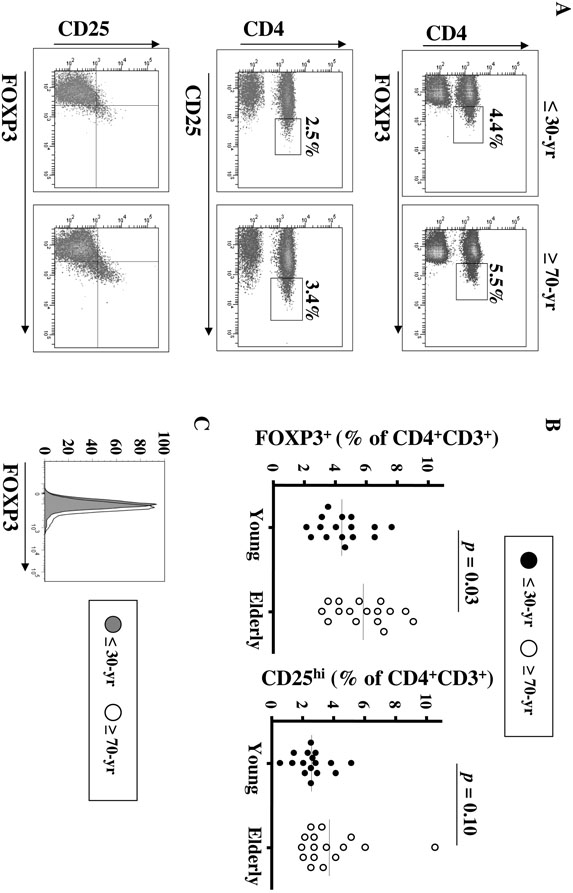
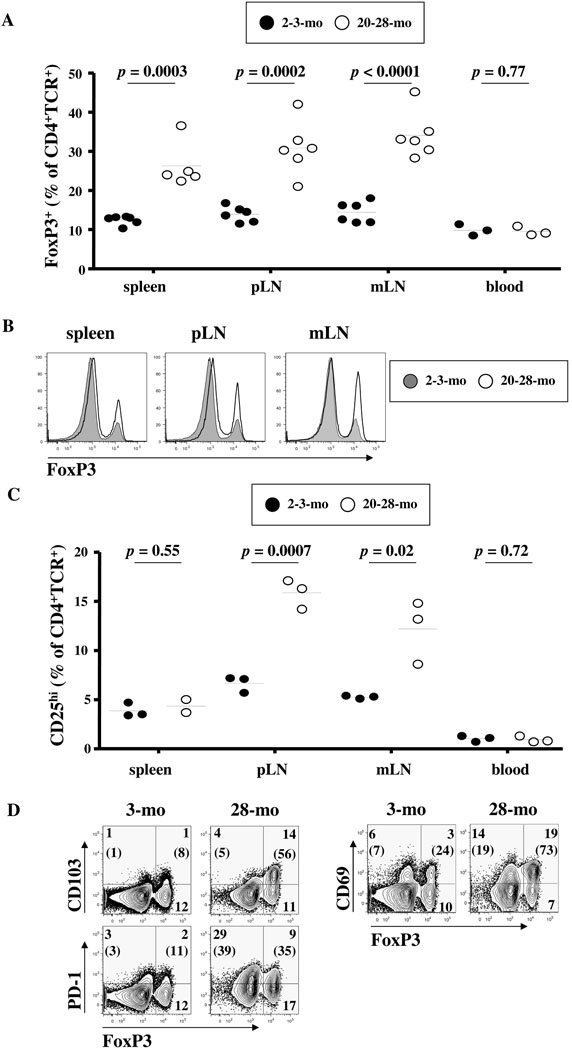
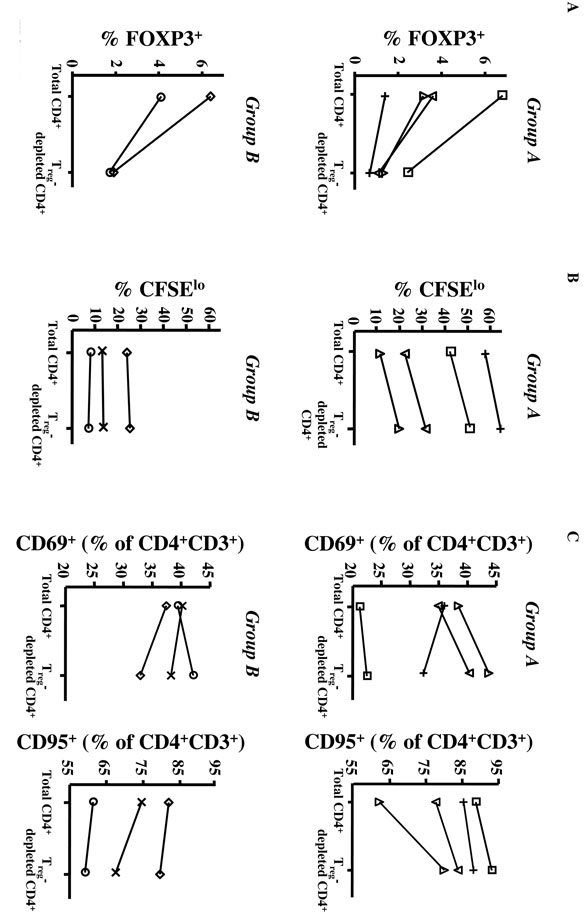
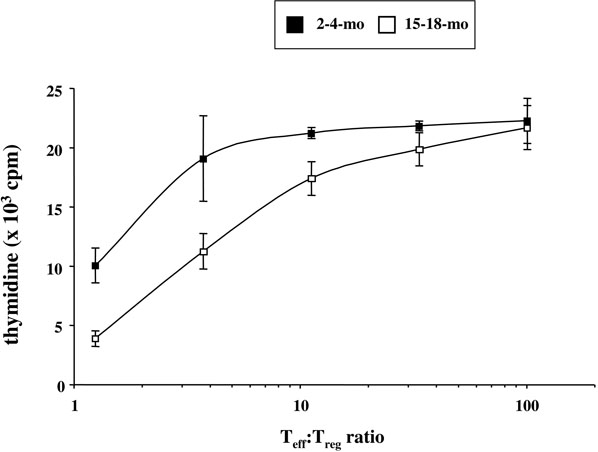
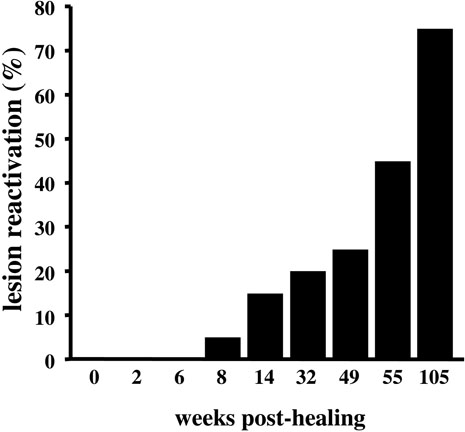
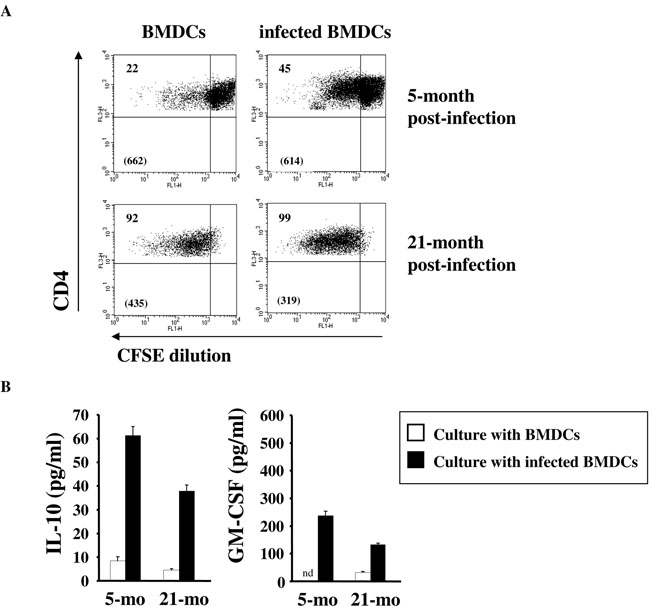
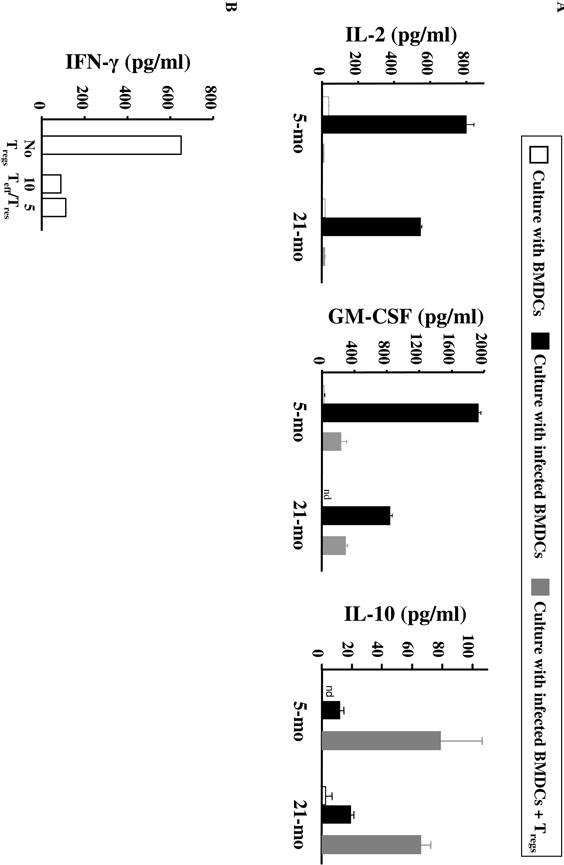
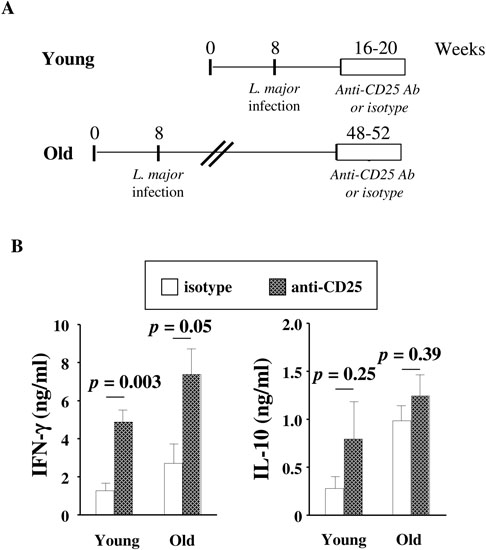
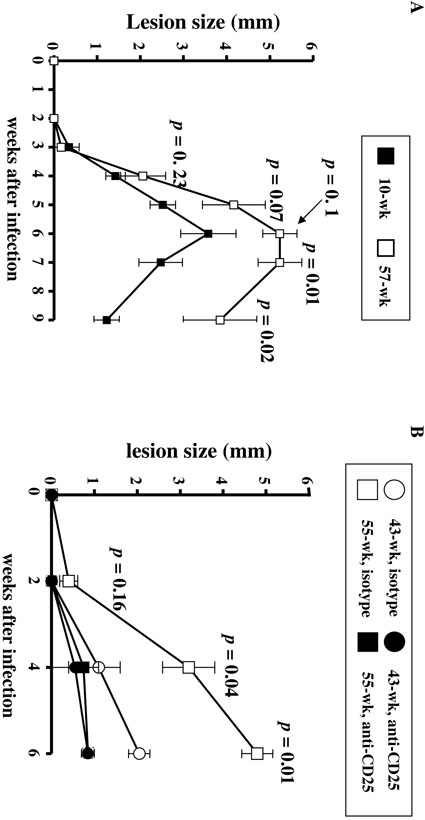
Declines in immune function are well described in the elderly and are considered to contribute significantly to the disease burden in this population. Regulatory T cells (T(regs)), a CD4(+) T cell subset usually characterized by high CD25 expression, control the intensity of immune responses both in rodents and humans. However, because CD25 expression does not define all T(regs), especially in aged hosts, we characterized T(regs) by the expression of FOXP3, a transcription factor crucial for T(reg) differentiation and function. The proportion of FOXP3(+)CD4(+) T(regs) increased in the blood of the elderly and the lymphoid tissues of aged mice. The expression of functional markers, such as CTLA-4 and GITR, was either preserved or increased on FOXP3(+) T(regs) from aged hosts, depending on the tissue analyzed. In vitro depletion of peripheral T(regs) from elderly humans improves effector T cell responses in most subjects. Importantly, T(regs) from old FoxP3-GFP knock-in mice were suppressive, exhibiting a higher level of suppression per cell than young T(regs). The increased proportion of T(regs) in aged mice was associated with the spontaneous reactivation of chronic Leishmania major infection in old mice, likely because old T(regs) efficiently suppressed the production of IFN-gamma by effector T cells. Finally, in vivo depletion of T(regs) in old mice attenuated disease severity. Accumulation of functional T(regs) in aged hosts could therefore play an important role in the frequent reactivation of chronic infections that occurs in aging. Manipulation of T(reg) numbers and/or activity may be envisioned to enhance the control of infectious diseases in this fragile population.


Figures

FIGURE 1
FIGURE 1. Treg frequency is increased in the blood of elderly individuals
Treg frequency was analyzed in PBMCs from 16 young (≤ 30-year old) and 16 elderly (≥ 70- year old) subjects. For FOXP3 staining, CD4CD3+ cells were used as negative control to determine the positivity threshold in CD4+CD3+ T cells. High expression of CD25 in CD4+ T cells was determined based on the absence of CD25hi cells within the CD3- cells. (A) Representative expression of FOXP3 and CD25 in young and elderly subjects. The percentages of FOXP3+CD4+ and CD25hiCD4+ cells in gated CD3+ T cells in a representative young and an elderly subject are shown in the upper and middle plot respectively. Expression of FOXP3 and CD25 in gated CD4+CD3+ T cells in a representative young and an elderly subject is shown in the lower plot. (B) Percentages of FOXP3+ and CD25hiCD4+CD3+ T cells in young and elderly subjects. Horizontal lines represent the mean values for each group. (C) Representative FOXP3 expression in gated CD4+CD3+ T cells from a 23-year old (filled line) and a 72-year old (unfilled line) donor.
FIGURE 2
FIGURE 2. Increased proportion of Tregs in aged mice
Single cell suspensions from spleens, peripheral (pLNs), mesenteric (mLNs) lymph nodes and blood were first stained for the surface markers CD4, TCR, CD25, CD69, CD103 and PD-1, followed by staining for the intracellular markers FoxP3. Flow cytometry analysis on gated CD4+TCR+ cells is shown. (A) Percentages of FoxP3+ cells in the CD4+TCR+ cell populations from 2-3- month old (closed circles) or 20-28-month old (open circles) mice. Horizontal lines represent the mean values for each group. (B) Representative overlay of Foxp3 expression in spleen, pLNs and mLNs cells from a 3-month (filled line) and a 28-month (unfilled line) old mouse. (C) Percentages of CD25hi cells in the CD4+TCR+ cell populations from 2-3-month old (closed circles) or 20-28-month old (open circles) mice. Horizontal lines represent the mean values for each group. (D) Expression of FoxP3 with CD69, CD103 and PD-1 is shown for splenic cells of a 3-month (left panel) or 28-month (right panel) old mouse, representative of 6 mice each. Values represent the percentages of each population in the indicated quadrant. Values in parenthesis are the percentages of gated FoxP3- (left) or FoxP3+ (right) cells that are positive for the Y axis marker.
FIGURE 3
FIGURE 3. Depletion of CD25hiCD4+ T cells from the blood of elderly individuals increased CD4 T cell function
5 × 10⁵ CFSE-labeled total CD4+ or Treg-depleted CD4+ (CD25-CD4+) T cells from 7 elderly individuals (≥ 70-year old) were cultured with 2 × 10⁵ autologous CD14+ monocytes and 2 μg/ml PHA for 3 days. (A) Percentage of FOXP3+ cells before CD25hi depletion (Total CD4+, left) and after CD25hi depletion (Treg-depleted CD4+, right). The values from the same subject are linked by a line. Group A is composed of the 4 individuals in whom Treg depletion led to increased proliferation, whereas group B comprised the 3 individuals who exhibited no increase in proliferation after PHA stimulation. The percentage of FoxP3+ cells following CD25 depletion was determined in all subjects, except subject X. (B) CFSE dilution and (C) the expression of CD69 and CD95 markers were analyzed by flow cytometry on gated CD4+CD3+ T cells. Percentages of dividing cells (CFSElow, corresponding to cells that have divided at least once), in total or Treg-depleted CD4+ T cells, are shown in (B). Percentages of CD69+ and CD95+ cells, in total or Treg-depleted CD4+ T cells, are shown in (C). Each individual is represented by the same symbol in panels (A), (B) and (C).
FIGURE 4
FIGURE 4. FoxP3+CD4+ T cell suppressive function is intact in aged mice
5 × 10⁴ GFPCD4+ T cells (Teffs) were sorted from LNs of 2-4-month old FoxP3-GFP knock-in C57BL/6 mice, and stimulated in triplicate with 0.5 μg/ml anti-CD3 and 1 × 10⁵ irradiated T cell-depleted spleen cells from the same mice. GFP+CD4+ T cells (Tregs) were sorted from LNs of 2-4-month (closed squares) or 15-18-month (open squares) old mice and co-cultured with Teffs at different Teff:Treg ratios, ranging from 1.3:1 to 101:1. Proliferation was measured by thymidine incorporation in the last 22 hours of a 3-day culture. In the absence of Tregs, 21,800 ± 2,075 cpm were counted.
FIGURE 5
FIGURE 5. L. major spontaneously reactivates in aged mice
8-week old C57BL/6 mice (n = 20) were inoculated in the ear dermis with 103 L. major metacyclic promastigotes. After the lesions were resolved 12 weeks later, mice were monitored for clinical signs of ear swelling and inflammation indicating a reactivation of the lesions.
FIGURE 6
FIGURE 6. Tregs from aged mice respond to L. major
8- to 10-week old C57BL/6 mice were inoculated in the ear dermis with L. major. 5 or 21 months later, CD25+CD4+ Tregs were purified by FACS from the draining LNs. 5 × 10⁴ CFSE-labeled T cells were restimulated with 1.4 × 10⁵ uninfected or L. major-infected BMDCs for 4 days. (A) CFSE dilution was analyzed by flow cytometry on gated CD4+TCR+ cells. Values in top left quadrants are the percentages of CFSElow cells. Values in parenthesis are the CFSE mean fluorescence intensities (MFI) within the CFSElow cells. (B) Cytokines were quantified in Treg cultures with uninfected BMDCs (open bars) or L. major-infected BMDCs (black bars). Results are representative of 6 independent experiments. nd, not detected.
FIGURE 7
FIGURE 7. Cytokine production by Teffs from L. major-infected mice in response to L. major antigens is blocked by Tregs
(A) 8- to 10-week old C57BL/6 mice were inoculated in the ear dermis with L. major. 5 or 21 months later, CD25+CD4+ (Tregs) and CD25-CD4+ (Teffs) were purified from the draining LNs (see Fig. 6). Teffs were cultured with uninfected BMDCs (open bars), L. major-infected BMDCs (black bars), or cocultured with Tregs (Teff:Treg ratio of 5:4) and L. major-infected BMDCs (grey bars). Cytokines were measured by ELISA. Results are representative of 6 independent experiments. nd, not detected. (B) FoxP3+ CD4+ T cells were sorted from FoxP3-GFP knock-in animals of 57-week old L. major-infected mice that were infected when young (9-10-week old). FoxP3+ cells were then mixed at different Teff:Treg ratios with Teffs (CD4+CD25-CD62L-) purified from a 22-week old infected mice in presence of L. major-infected BMDCs. IFN-_ was measured by ELISA in 4 day-supernatant.
FIGURE 8
FIGURE 8. In vivo depletion of Tregs in old L. major-infected mice increases the production of IFN-γ by Teffs at the infection site
(A) Old L. major-infected mice (> 48 week old, which had been infected when they were 8-week old) or young L. major-infected mice (16-week old, which had been infected when they were 8-week old) were treated with anti-CD25 Ab or isotype control (N = 4/group) (1 mg for 3 weeks, twice a week). After Ab treatment, mice were sacrificed. T cells were purified from the infection site and draining LNs and restimulated in vitro with L. major-infected BMDCs. (B) IFN-γ and IL-10 were measured by ELISA in 4-day supernatants. P values correspond to the comparisons between mice treated with isotype control (open symbols) or anti-CD25 Ab (hatched symbols) using t-tests.
FIGURE 9
FIGURE 9. L. major causes exacerbated disease in old mice, and Tregs contribute to such increased disease severity
(A) Primary infection with L. major parasites: 4 young mice (10-week old) and 3 old C57BL/6 mice (57-week old) were inoculated in the ear dermis with 103 L. major metacyclic promastigotes. Lesion size was measured weekly in all animals. Mean (and SD) lesion sizes (mm) are shown for young (black symbols) and old (white symbols) mice. P values indicate differences at each time point (t-test). At 7 weeks post-infection, one of the old mice lost an ear through an acute necrotic process. (B) Effect of anti-CD25 Ab on primary L. major infection in old mice. Two 43-week old mice (black circles) and two 55-week old mice (black squares) received anti-CD25 treatment (1 mg for 3 weeks, twice a week) at the time of L. major infection. Three 43- week old mice (white circles) and three 55-week old mice (white squares) received the isotype control Ab following the same regimen. Lesion size (mm) was measured weekly in all animals. P values correspond to the differences in lesion size between anti-CD25- treated and isotype-treated mice, at the indicated time points.

Similar articles

Cited by

References

    1. Effros RB. Long-term immunological memory against viruses. Mech Ageing Dev. 2000;121:161–171. - PubMed
    1. Murasko DM, Bernstein ED, Gardner EM, Gross P, Munk G, Dran S, Abrutyn E. Role of humoral and cell-mediated immunity in protection from influenza disease after immunization of healthy elderly. Exp Gerontol. 2002;37:427–439. - PubMed
    1. Gavazzi G, Krause KH. Ageing and infection. Lancet Infect Dis. 2002;2:659–666. - PubMed
    1. Effros RB. Role of T lymphocyte replicative senescence in vaccine efficacy. Vaccine. 2007;25:599–604. - PubMed
    1. Rytel MW. Effect of age on viral infections: possible role of interferon. J Am Geriatr Soc. 1987;35:1092–1099. - PubMed

Publication types

MeSH terms