. 2008 Aug 1;181(3):1859-68.
doi: 10.4049/jimmunol.181.3.1859.

Identification of an evolutionarily conserved transcriptional signature of CD8 memory differentiation that is shared by T and B cells

Affiliations

Identification of an evolutionarily conserved transcriptional signature of CD8 memory differentiation that is shared by T and B cells

W Nicholas Haining et al. J Immunol. .

Abstract

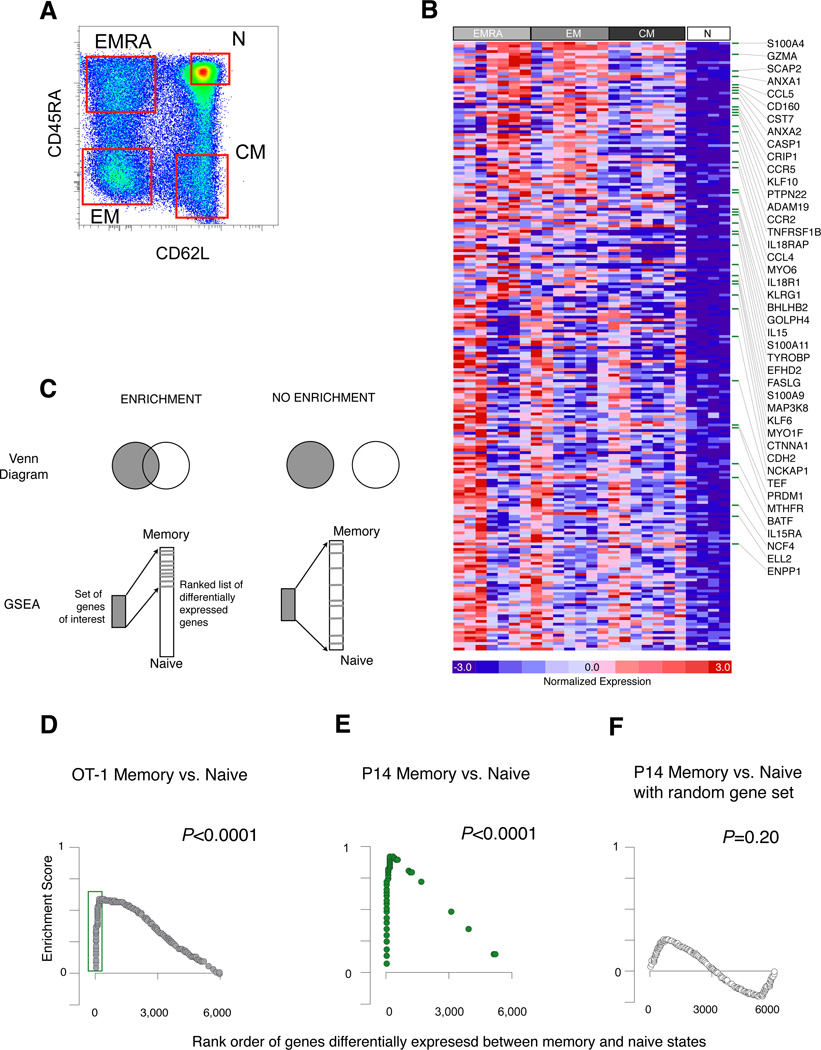
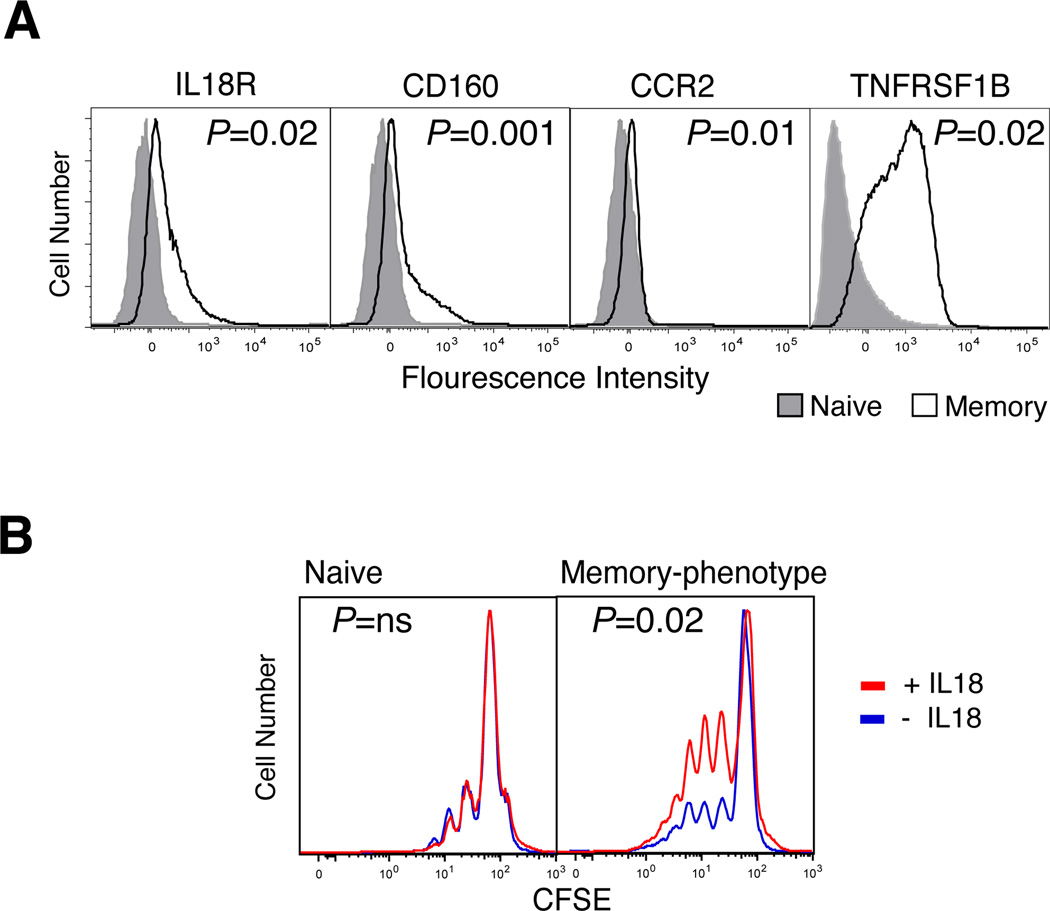
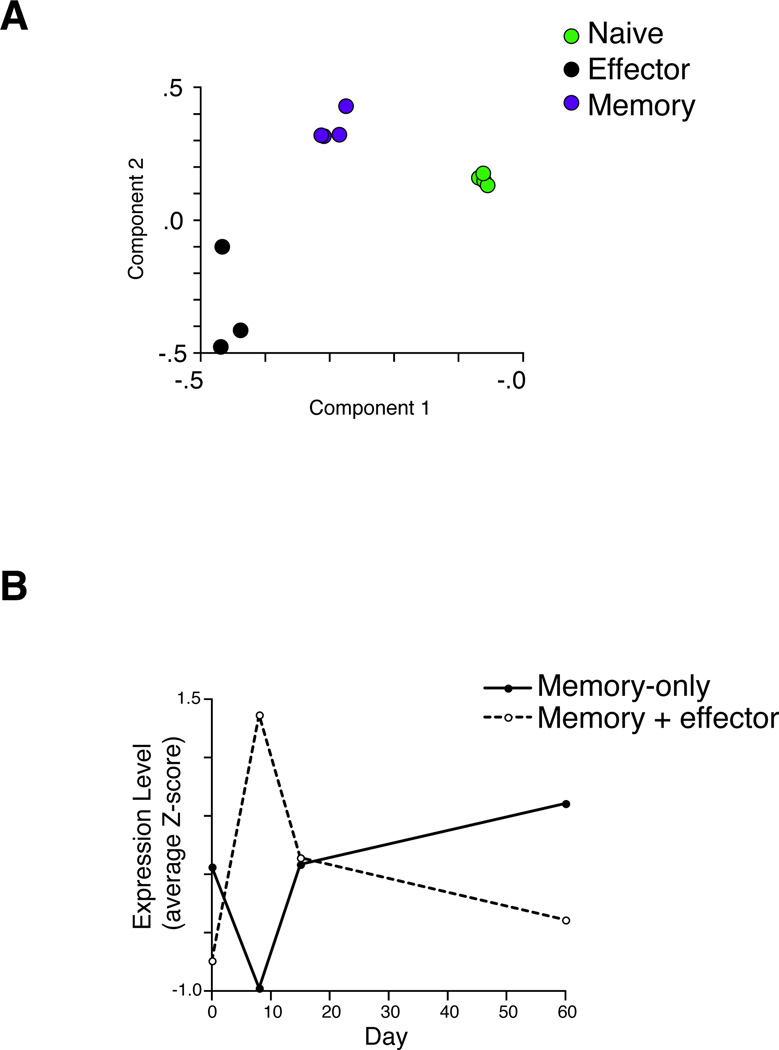
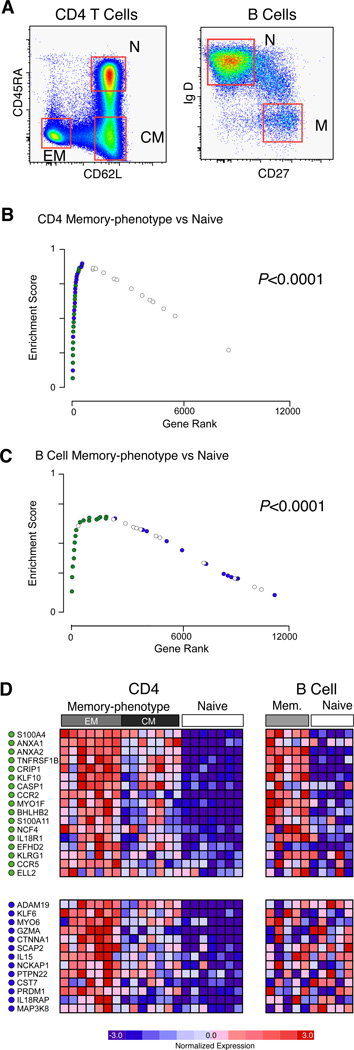
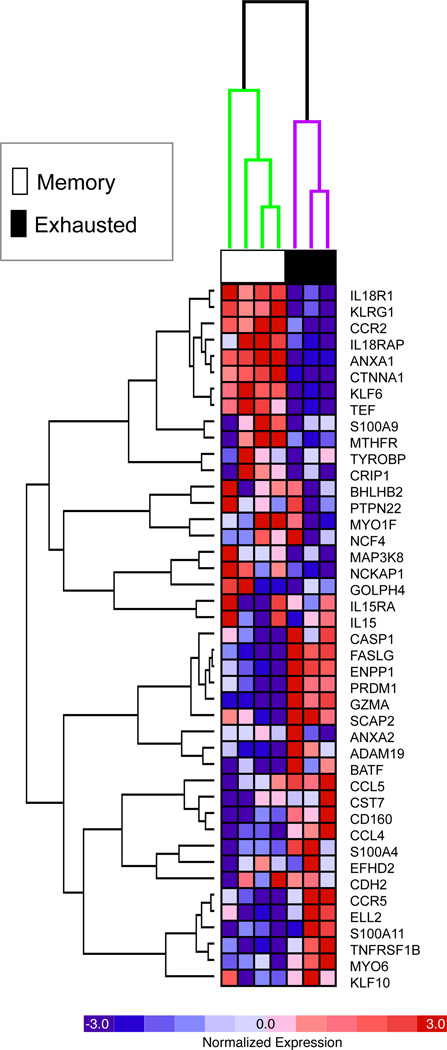
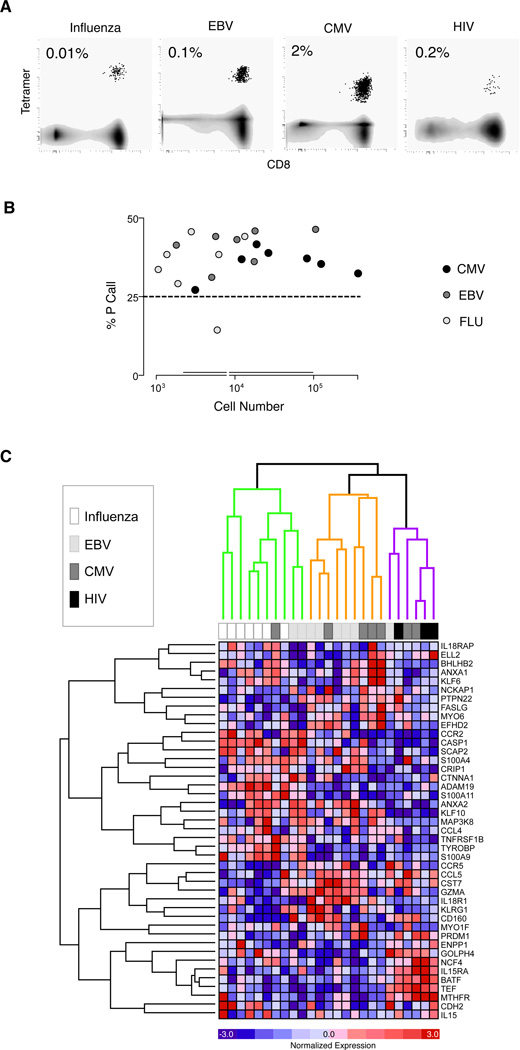
After Ag encounter, naive lymphocytes differentiate into populations of memory cells that share a common set of functions including faster response to Ag re-exposure and the ability to self-renew. However, memory lymphocytes in different lymphocyte lineages are functionally and phenotypically diverse. It is not known whether discrete populations of T and B cells use similar transcriptional programs during differentiation into the memory state. We used cross-species genomic analysis to examine the pattern of genes up-regulated during the differentiation of naive lymphocytes into memory cells in multiple populations of human CD4, CD8, and B cell lymphocytes as well as two mouse models of memory development. We identified and validated a signature of genes that was up-regulated in memory cells compared with naive cells in both human and mouse CD8 memory differentiation, suggesting marked evolutionary conservation of this transcriptional program. Surprisingly, this conserved CD8 differentiation signature was also up-regulated during memory differentiation in CD4 and B cell lineages. To validate the biologic significance of this signature, we showed that alterations in this signature of genes could distinguish between functional and exhausted CD8 T cells from a mouse model of chronic viral infection. Finally, we generated genome-wide microarray data from tetramer-sorted human T cells and showed profound differences in this differentiation signature between T cells specific for HIV and those specific for influenza. Thus, our data suggest that in addition to lineage-specific differentiation programs, T and B lymphocytes use a common transcriptional program during memory development that is disrupted in chronic viral infection.


Figures

Figure 1
Figure 1. CD8 memory T cell differentiation signature is conserved between human and mouse
(A) Human memory-phenotype and naïve peripheral blood CD8 cells were sorted from healthy human donors using sort gates designed to capture central memory (CM), effector memory (EM), effector memory/CD45RA+ (EMRA) or naïve T cells (N). (B) Genes distinguishing memory phenotype (CM, EM, and EMRA) from naïve samples were identified and ranked. Relative expression levels of all 220 genes significantly associated with the memory-phenotype class distinction (P<0.01) are shown where each column represents an individual donor and each row a gene. For each gene, relatively high expression is indicated in red, low in blue. Genes enriched in the OTI mouse model of CD8 memory differentiation are indicated by green bars on the right. (C) Schematic representation of GSEA. A list of genes for a particular comparison of interest (e.g., human CD8 memory-phenotype versus naive) is tested for enrichment in the rank order of differentially expresed genes derived from an independently generated gene set (e.g, mouse CD8 memory versus naive). Gene sets that are related would be expected to enriched at the top of the rank ordered list. (D) The 220-member set of genes defined in Figure 1B was tested for enrichment in the expression profile of mouse OTI TCR transgenic memory CD8 T cells compared with naive OTI cells using gene-set enrichment analysis (GSEA). Each point represents an individual gene in the gene set, and its running enrichment score and position in the rank-ordered list of mouse memory vs. naive genes is shown. Those most enriched in mouse memory – the leading-edge genes – are highlighted in green (left panel) and correspond to the genes marked in Figure 1B with green bars. (E) Enrichment of leading edge genes from Figure 1D in LCMV memory vs. naive expression profile. (F) Enrichment of a random set of genes in LCMV memory vs. naive expression profile shows no significant enrichment, confirming specificity of analysis.
Figure 2
Figure 2. Functional validation of memory signature in human CD8 T cells
(A) Validation of markers of memory differentiation in human CD8 T cells. Mean expression on the surface of naive or memory-phenotype CD8 human T cells (n=5; representative donor shown) was measured by flow cytometry and significance determined by paired T-test. (B) Functional validation of IL18R as a marker of memory differentiation. CFSE-stained, peripheral blood naïve or memory CD8 T cells were cultured with suboptimal CD3 stimulation in the presence (red line) or absence (blue line) of IL18 (50ng/mL). The fraction of proliferating naive (left panel) or memory-phenotype (right panel) CD8 T cells was determined on day 6 (n=4; representative donor shown) and significance determined by paired T test.
Figure 3
Figure 3. Memory differentiation signature is distinct from T cell effector signature
(A) Clustering by principal components analysis of naive (green), effector (black) and memory (purple) LCMV-specific T cells in the space of the conserved CD8 differentiation signature. (B) The relative expression of the genes in the memory or effector component of the CD8 signature determined in P14 CD8 T cells before, during and after acute LCMV infection. Composite expression level of all genes in signature calculated as Z-score to adjust for wide variation in baseline expression levels of genes in the signature. Each symbol represents mean Z-score from naïve cells (day 0), effectors (day 8) and memory cells (day 60).
Figure 4
Figure 4. Components of the CD8 memory T cell differentiation signature are shared by T and B cell lineages
(A) Naïve (N), central memory (CM) or effector memory (EM) CD4 T cells were identified and sorted using gates shown (left panel). Naïve or memory (M) B cells were identified within the CD19+ compartment and sorted using gates shown (right panel). (B, C) The conserved CD8 memory signature was tested by GSEA in (B) CD4 or (C) B cell memory-phenotype vs naive profiles. Green symbols indicate genes enriched in both CD4 and B memory-phenotype cells; blue symbols, enrichment only CD4 memory-phenotype cells; white symbols, enrichment only in CD8 memory phenotype profile. (D). The relative expression of genes from the CD8 memory signature in CD4 (left panels) or B cells (right panels) memory signatures are shown with genes ranked by signal-to-noise metric. Upper panels correspond to genes in the CD8 memory signature enriched in CD4 and B memory cells, lower panels to genes enriched in CD4 memory but not B cell memory. Green and blue symbols correspond to points in Figure 4B and C.
Figure 5
Figure 5. T cell exhaustion disrupts memory differentiation in mouse CD8 T cells
Unsupervised hierarchical clustering discriminates between exhausted and functional memory LCMV-specific CD8 T cells in the space of the conserved memory signature. Expression levels are normalized across each row, i.e. expression levels of samples are presented relative to each other.
Figure 6
Figure 6. Differentiation signature distinguishes human antigen-specific T cells from acute and chronic viral infection
(A) Human CD8 T cells specific for HLA-A*0201-restricted immunodominant epitopes from Influenza, EBV, CMV and HIV were identified and sorted with MHC-peptide tetramers as shown. Percentages refer to fraction of CD8 T cells stained with tetramer in these representative plots. Grey contours represent total CD8 T cells; black dot plots, tetramer positive cells in the sort gate. (B) High quality microarray data is generated from small cell numbers. Percentage of transcripts assessed as “present” (P Call) versus cell number for samples of tetramer sorted CMV, EBV, or influenza-specific T cells. Dotted line represents adequate data quality; double line on X-axis, interquartile range; line break on X-axis median. (B) Unsupervised hierarchical clustering of samples and genes in human antigen-specific T cells in the space of the conserved CD8 memory differentiation signature.

Similar articles

Cited by

References

    1. Masopust D, Kaech SM, Wherry EJ, Ahmed R. The role of programming in memory T-cell development. Curr Opin Immunol. 2004;16:217–225. - PubMed
    1. Bertoletti A, Gehring AJ. The immune response during hepatitis B virus infection. J Gen Virol. 2006;87:1439–1449. - PubMed
    1. McMichael AJ. HIV vaccines. Annu Rev Immunol. 2006;24:227–255. - PubMed
    1. McHeyzer-Williams LJ, McHeyzer-Williams MG. Antigen-specific memory B cell development. Annu Rev Immunol. 2005;23:487–513. - PubMed
    1. Swain SL, Agrewala JN, Brown DM, Jelley-Gibbs DM, Golech S, Huston G, Jones SC, Kamperschroer C, Lee WH, McKinstry KK, Roman E, Strutt T, Weng NP. CD4+ T-cell memory: generation and multi-faceted roles for CD4+ T cells in protective immunity to influenza. Immunol Rev. 2006;211:8–22. - PMC - PubMed

Publication types

MeSH terms