. 2008 Aug 1;181(3):2111-23.
doi: 10.4049/jimmunol.181.3.2111.

CD8+ T lymphocytes control murine cytomegalovirus replication in the central nervous system of newborn animals

Affiliations

CD8+ T lymphocytes control murine cytomegalovirus replication in the central nervous system of newborn animals

Glenn R B Bantug et al. J Immunol. .

Abstract

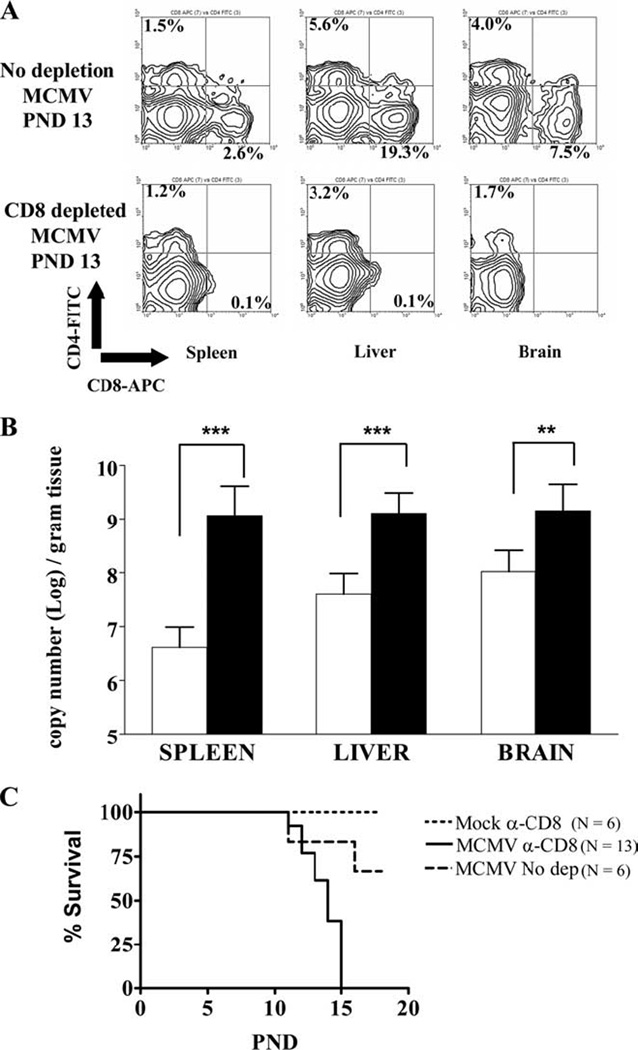
Human CMV infection of the neonatal CNS results in long-term neurologic sequelae. To define the pathogenesis of fetal human CMV CNS infections, we investigated mechanisms of virus clearance from the CNS of neonatal BALB/c mice infected with murine CMV (MCMV). Virus titers peaked in the CNS between postnatal days 10-14 and infectious virus was undetectable by postnatal day 21. Congruent with virus clearance was the recruitment of CD8(+) T cells into the CNS. Depletion of CD8(+) T cells resulted in death by postnatal day 15 in MCMV-infected animals and increased viral loads in the liver, spleen, and the CNS, suggesting an important role for these cells in the control of MCMV replication in the newborn brain. Examination of brain mononuclear cells revealed that CD8(+) T cell infiltrates expressed high levels of CD69, CD44, and CD49d. IE1(168)-specific CD8(+) T cells accumulated in the CNS and produced IFN-gamma and TNF-alpha but not IL-2 following peptide stimulation. Moreover, adoptive transfer of brain mononuclear cells resulted in decreased virus burden in immunodepleted MCMV-infected syngeneic mice. Depletion of the CD8(+) cell population following transfer eliminated control of virus replication. In summary, these results show that functionally mature virus-specific CD8(+) T cells are recruited to the CNS in mice infected with MCMV as neonates.


Figures

Figure 1
Figure 1. MCMV disseminates to the CNS following peripheral inoculation of neonatal mice
(A) Newborn mice (6–18 hours post partum) were inoculated i.p. with 200 PFU of tissue culture derived MCMV-Smith strain. A standard plaque assay was used to determine virus titers in the spleen (left), liver (center) and brain (right). (B–D) Photomicrographs of paraffin sections from MCMV infected animals stained with cresyl violet. Inflammatory foci (arrows) are detected in the hippocampus at PN day 14 (B, ×10), cerebral cortex at PN day 18 (C, ×20) and in the CNS parenchyma at PN day 14 (C, ×40). (E–G) Paraffin sections from MCMV infected pups were processed and stained with anti-MCMV IE1/pp89 mAb and counterstained with hematoxylin. Virus infected cells (arrowheads) are identified in the cerebellum (PN day 9, E, 40×), cerebrum (PN day 8, F, 40×) and liver (PN day 14, G, 40×).
Figure 2
Figure 2. CD8+ T-cells are the predominant mononuclear cellular infiltrate recruited to the CNS in MCMV infected newborn mice
(A–C) Photomicrographs of MCMV infected brain stained with antibodies against common mononuclear cell markers. Mac-3+ mononuclear cells were detected in the cerebrum at (PN day 12, A, 40×). CD4 (B, 20×) and CD8 (C, 40×) positive cells were present in the cerebellum at PN day 17. (D,E) Representative flow cytometry contour plots of control and MCMV infected brain and liver mononuclear cells isolated as described in the Materials and Methods section. (D) To identify brain macrophage/microglia populations mononuclear cell isolates were stained with F4/80-APC and CD45-PE monoclonal antibodies. Flow cytometry plots shown were representative of two separate experiments with 3–4 animals per group. (E) The frequency of αβ T-lymphocyte subsets was determined by staining with CD4-FITC and CD8-APC antibodies. Percentages shown are based on total number of gated events. (F) Bar graphs representing the summary of CD8 and CD4 T-cell frequencies in the brain (white bars) and liver (black bars) following MCMV infection. Values denote mean frequencies (± SEM, n = 3–5) from two independent experiments. All flow cytometry plots (D, E) were gated on the total mononuclear cell population.
Figure 3
Figure 3. Control of virus replication in the CNS correlates with CD8+ T-cell infiltration
Line graphs indicating the kinetics of infectious virus clearance (virus titer, right y-axis) plotted with mean T-cell frequencies for each subset (left y-axis) as a function of days post-infection. Brain (top) and Liver (bottom) values are mean frequencies for each T-cell subset and mean virus titers at each indicated time point (± SEM, n = 3–5, ND = not determined).
Figure 4
Figure 4. Depletion of CD8+ T-cell population results in increased viral burden in the CNS
(A) Representative flow cytometry contour plots of CD4 and CD8 stained brain, liver and spleen cells from MCMV infected, untreated animals (top panel) and from MCMV infected, CD8 depleted animals (bottom panel). Cells isolated from PN day 13 animals as described in the Materials and Method section and stained with CD4-FITC and CD8-APC antibodies. Percentages shown are based on total number of gated mononuclear cells. (B) Taqman real time PCR was used to quantify viral genome copy number in untreated (open bars) and CD8 depleted (closed bars) animals on PN day 13 as described in Materials and Methods. Bar graphs indicate mean values (± SD, n = 4–7). **, p=0.0036 and ***, p<0.0001 for the compared values by Students T-test. (C) Survival curves for CD8 depleted-uninfected control animals (n=6), untreated-infected animals (n=6), and CD8 depleted-infected animals (n=13). Groups were analyzed statistically by log-rank test and significant differences were noted between CD8 depleted infected and untreated-infected groups (p=0.0041).
Figure 5
Figure 5. Responding CD8+ T-cells and Macrophages in the CNS display an activated phenotype
(A) Activation profiles of CD8+ T-cells. Brain and liver mononuclear cells from PN day 14 and 28 MCMV infected animals were processed and stained with activation markers, CD44-FITC, CD69-PE, CD62L-FITC, CD49d-PE and CD8-APC. Top panel contour plots are stained with CD44 and CD69. Bottom panel contour plots were stained with CD62L and CD49d. Both top and bottom panels were gated on CD8+ cells. Percentages shown are based on total CD8+ cells (n = 3–4). (B) Activation profiles of macrophage/microglia sub-population in the CNS. Brain mononuclear cells from PN day 14 MCMV infected animals were stained with the macrophage/microglia marker F4/80-APC and CD45-FITC and the activation markers CD80-PE and CD40-PE. F4/80 positive populations were further sub-divided into three distinct groups (left, density plot), CD45hi (infiltrating brain macrophages, top histograms), CD45int (activated microglia, middle histograms) and CD45lo (quiescent microglia, bottom histograms) stained with CD40 (left panel) and CD80 (right panel). The percentages of each macrophage/microglia subpopulation that express CD40 and the percentages of CD80lo and CD80hi positive cells for each subpopulation are shown (n = 4) and are representative of two separate experiments.
Figure 6
Figure 6. IE1168 specific CD8+ T-cells accumulated in both the CNS and liver in MCMV infected animals
(A) Representative flow cytometry contour plots of brain and liver mononuclear cells from MCMV infected animals, PN days 14–28, stained with IE1168 TET-APC and CD8-PE. Percentages shown are based on total gated cells. (B) Enumeration of IE1168posCD8pos T-cells in the brain (white bar) and liver (black bar). Values represent mean frequencies based on the total CD8+ T-cell population (± SD, n = 4–7) and are representative of two independent experiments. **, p=0.0056.
Figure 7
Figure 7. Ex-vivo stimulation with IE1168 peptide results in IFN-γ production by brain and liver CD8+ T-cells
(A) Flow cytometry density plots of brain and liver mononuclear cells from PN day 18, MCMV infected animals stained with IFN-γ-FITC and CD8-APC following stimulation with IE1168 or with PMA/Ionomycin for 6 hours and incubation with Brefeldin A during the last 4 hours. Frequency distribution expressed as percentage of CD8+ T-lymphocytes and calculated from total population of gated mononuclear cells that were CD8+. (B) Bar graph depicting the summary of IE1168 peptide ex-vivo stimulation analysis on mononuclear cells from MCMV infected animals at PN days 14, 18, 22 and 28. Indicated are brain (white bar), liver (hatched bar) no stimulation controls and brain (black bar) and liver (gray bar) peptide stimulated samples. Percentages based on total CD8+ T-cells (n = 4–5). (C) Bar graph depicting the summary of PMA/Ionomycin stimulation analysis on similar parameters as described in panel B. Indicated are samples from the brain (black bar) and liver (gray bar) (n = 4–5). (D) Comparative analysis bar graphs on the frequency of IFN-γposCD8pos T-cells following IE1168 peptide stimulation (white bar) versus the frequency of IE1168posCD8pos T-cells (black bar) as a function of day 14, 18, and 22 post-infection from MCMV infected animals (± SD, n = 4–7). Data shown are representative of 2 independent experiments the values analyzed by Mann-Whitney test for non-parametric distribution. Statistical differences were noted only for frequencies of IFN-γposCD8pos T-cells and IFN-γposCD8pos T-cells isolated from the brain on day 22 (*, p=0.0159). ns = not significant.
Figure 8
Figure 8. Key differences in functional signatures between liver and brain CD8+ T-cells are observed early in infection
(A) PN day 14 mononuclear cells from the brain and liver of MCMV infected animals were ex-vivo stimulated with IE1168 peptide or with PMA/Ionomycin for 6 hours then stained with IFN-γ-FITC, TNF-α-PE, IL-2-PE and CD8-APC. Density plots are based on gated CD8+ T-cells populations. Percentages shown are means (n = 4) of two separate experiments. (B) Animals were treated with BrdU 6 hours prior to sacrifice at PN day 13. Representative flow cytometry plots of brain and liver mononuclear cells from BrdU treated animals show CD8-PE and BrdU-FITC staining (top panel). Percentages are based on total gated cells. The bar graph (middle panel) represents mean frequencies of total CD8+ T-cell populations from brain and liver (± SD, n = 4). Flow cytometry plots (middle panel) show IE1168 tetramer-APC and BrdU-FITC staining. Percentages calculated from total gated CD8+ T-cells. The bar graph (bottom panel) represents mean frequencies of total IE1168+CD8+ T-cell population (± SD, n = 4) of two separate experiments. (C) PN day 14 brain and liver mononuclear cells were ex-vivo stimulated with IE1168 peptide for 6 hours during which CD107a-PE antibodies were incubated with the cells. Representative flow plots from liver and brain isolates were gated on CD8+ cells and stained with IFN-γ-FITC. Percentages calculated from total CD8+ T-cell population. Bar graphs are summaries of the previous experiments. Values indicate mean frequencies from total CD8+ T-cell population (± SD, n = 4).
Figure 9
Figure 9. Protective capacity of CNS-derived CD8+ T-cells after transfer into immunodepleted recipients
6 week old MCMV infected, lethally irradiated animals received 2×10⁵ mononuclear cells isolated from either brain or spleen of age-matched Balb/c mice, neonatally infected with MCMV. Nine days after transfer mice were sacrificed and virus titers measured in spleen, lungs and liver. Depletion of CD8+ subset is described in the Materials and Method section. Each point represents the virus titer for an individual animal and horizontal bar is the median of each group. LD=limit of detection.

Similar articles

Cited by

References

    1. McCracken GH, Jr, Shinefield HM, Cobb K, Rausen AR, Dische R, Eichenwald HF. Congenital cytomegalic inclusion disease. A longitudinal study of 20 patients. Am J Dis Child. 1969;117:522–539. - PubMed
    1. Weller TH, Hanshaw JB. Virologic and clinical observations on cytomegalic inclusion disease. N Engl J Med. 1962;266:1233–1244. - PubMed
    1. Williamson WD, Desmond MM, LaFevers N, Taber LH, Catlin FI, Weaver TG. Symptomatic congenital cytomegalovirus. Disorders of language, learning, and hearing. Am J Dis Child. 1982;136:902–905. - PubMed
    1. Stagno S. Cytomegalovirus. In: Remington J, Klein JO, editors. Infectious Diseases of Fetus and Newborn. Philadelphia: W.B. Saunders Company; 2001.
    1. Weller TH. The cytomegaloviruses: ubiquitous agents with protean clinical manifestations. I. N Engl J Med. 1971;285:203–214. - PubMed

Publication types

MeSH terms

Substances