. 2008 Aug;10(8):955-63.
doi: 10.1038/ncb1755. Epub 2008 Jul 20.

Actin restricts FcepsilonRI diffusion and facilitates antigen-induced receptor immobilization

Affiliations

Actin restricts FcepsilonRI diffusion and facilitates antigen-induced receptor immobilization

Nicholas L Andrews et al. Nat Cell Biol. 2008 Aug.

Abstract

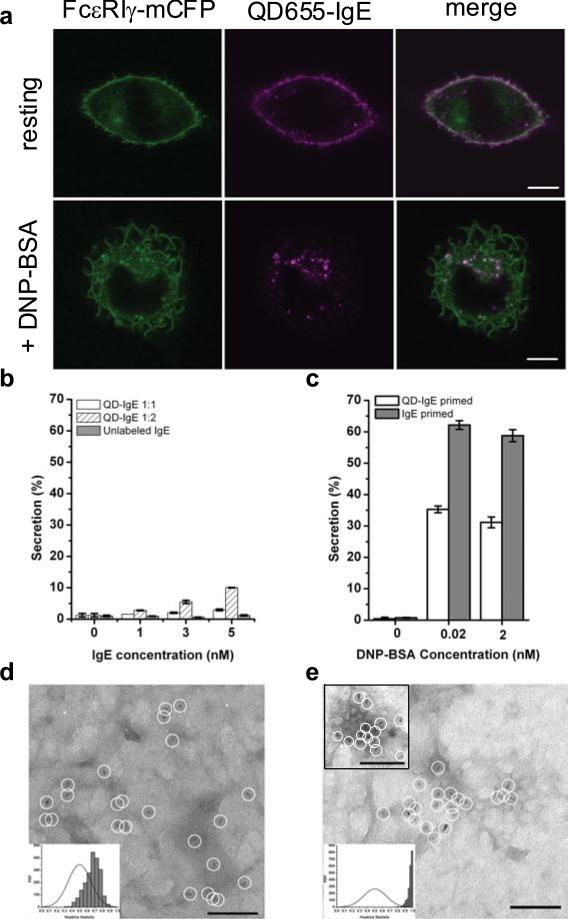
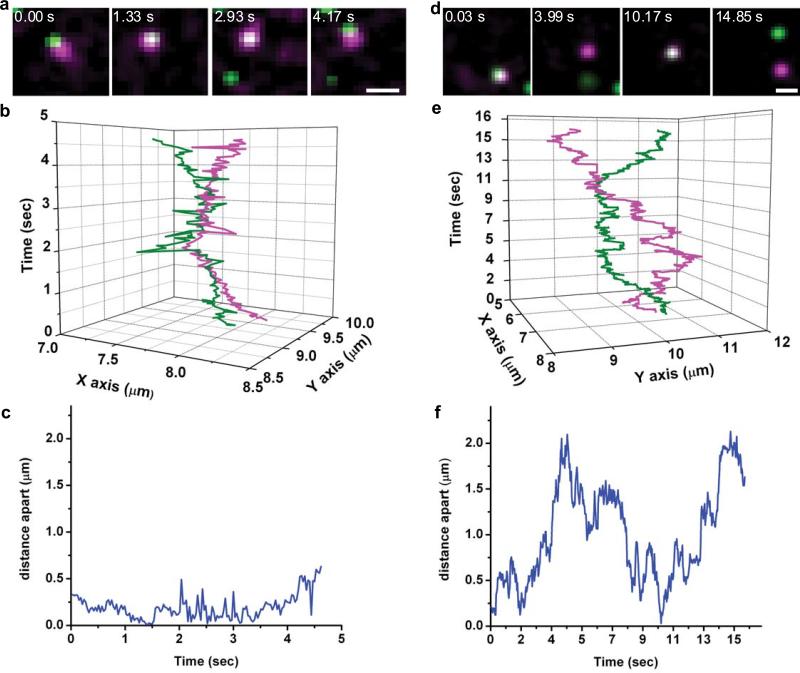
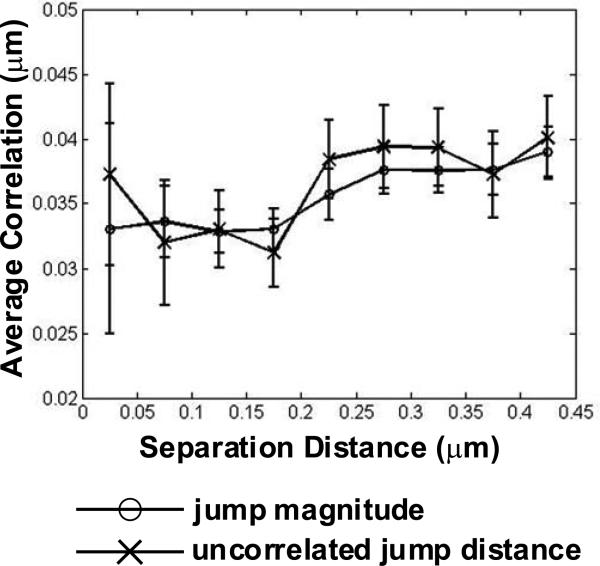
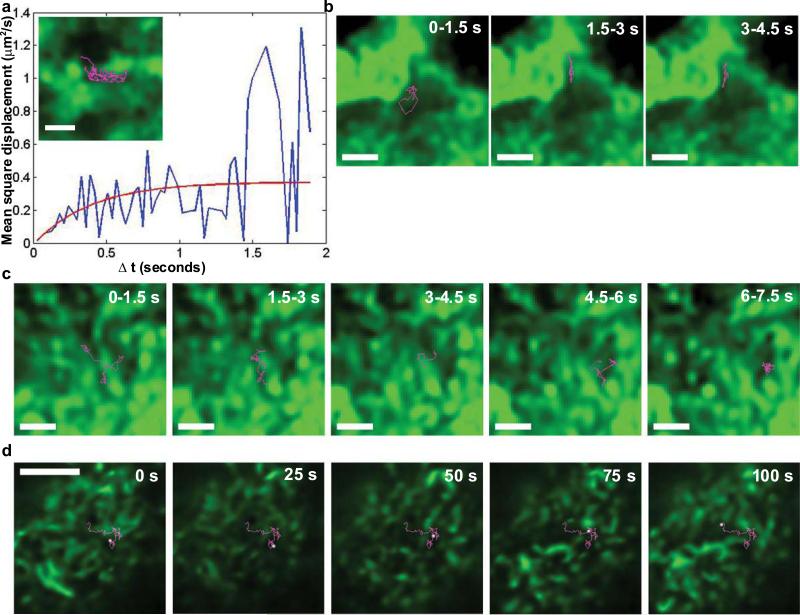
The actin cytoskeleton has been implicated in restricting diffusion of plasma membrane components. Here, simultaneous observations of quantum dot-labelled FcepsilonRI motion and GFP-tagged actin dynamics provide direct evidence that actin filament bundles define micron-sized domains that confine mobile receptors. Dynamic reorganization of actin structures occurs over seconds, making the location and dimensions of actin-defined domains time-dependent. Multiple FcepsilonRI often maintain extended close proximity without detectable correlated motion, suggesting that they are co-confined within membrane domains. FcepsilonRI signalling is activated by crosslinking with multivalent antigen. We show that receptors become immobilized within seconds of crosslinking. Disruption of the actin cytoskeleton results in delayed immobilization kinetics and increased diffusion of crosslinked clusters. These results implicate actin in membrane partitioning that not only restricts diffusion of membrane proteins, but also dynamically influences their long-range mobility, sequestration and response to ligand binding.


Figures

Figure 1
Figure 1
QD-IgE serves as a non-perturbing probe of FcεRI diffusion. (a) RBL-2H3 cells stably expressing FcεRI-gamma-mCFP were labelled with 1 nM QD655-IgE and then imaged (top panels) or cross-linked with 14 nM DNP-BSA for 10 min prior to imaging (bottom panels). (b,c) Degranulation assay plots showing the percentage of total β-hexosaminidase content secreted in response to 30 min incubation at 37°C with various IgE (b) or after priming with QD-IgE or IgE in response to various amounts of DNP-BSA (c). (d,e) Individual QD655-IgE-FcεRI are indicated by white circles in electron micrographs from membrane sheets prepared from RBL-2H3 cells labelled with QD655-IgE (d) and stimulated for 10 min with 14 nM DNP-BSA (e) before fixation. A right shift in the experimental data (grey bars) away from a random distribution (solid line) in the Hopkins plot indicates a slightly clustered distribution of QD655-IgE-FcεRI in the resting state (d, inset) and a highly clustered distribution after cross-linking (e,inset). The scale bars represent 10 μm in a and 100 nm in d and e.
Figure 2
Figure 2
FcεRI are co-confined. (a) Sample images from a time series showing two QD-IgE-FcεRI complexes co-confined within a ~500 nm domain. (b) XY versus time plot of trajectories of QD655-IgE-FcεRI (magenta) and QD585-IgE-FcεRI (green) from time series shown in a. (c) Plot of interparticle distance versus time for particles shown in a. (d) Sample images from a time series showing two QD-IgE-FcεRI complexes co-confined within a ~2 μm domain. (e) XY versus time plot of trajectories of QD655-IgE-FcεRI (magenta) and QD585-IgE-FcεRI (green) from time series shown in d. (f) Plot of interparticle distance versus time for particles shown in d. Images in a and d have been Gaussian filtered. Images were acquired on the apical surface at 33 frames/s. The scale bars represent 1 μm in a and d.
Figure 3
Figure 3
Motion of QD-IgE-FcεRI is consistent with co-confinement; not attraction. Mean distance of uncorrelated jump distance (x-marks) and jump magnitude (open circles) plotted as a function of distance between QD-IgE-FcεRI complexes. Data are presented as mean ± s.e.m. of 1,128 instances of QD-IgE-FcεRI complexes approaching within 0.5 μm.
Figure 4
Figure 4
Actin defines regions of FcεRI motion in the membrane. (a) MSD plot of the trajectory shown in inset, demonstrating diffusion restricted to an area consistent with that delineated by the actin structures. (a, inset) QD-IgE-FcεRI trajectory (magenta) overlayed with the deconvolved GFP-actin image (green) from the adherent surface of a PMA-treated RBL-2H3 cell. (b,c) Image series of deconvolved GFP-actin (green) and 1.5 s long segments of a single QD655-IgE-FcεRI trajectory (magenta) on the adherent surface of a PMA treated (b) or untreated (c) RBL-2H3 cell. (d) Full 100 s QD-IgE-FcεRI trajectory (magenta) with position at 25 s intervals highlighted (white) overlayed with the deconvolved GFP-actin image (green) on the apical membrane of an RBL-2H3 cell. Panels a-c were acquired with TIRF microscopy at 33 frames/s. Panel d is from a 1 frame/s confocal time series with 1 μm slice thickness. The scale bars represent 1 μm in a-c and 5 μm in d.
Figure 5
Figure 5
Effect of actin proximity on FcεRI trajectories. All QD-IgE trajectories found by TIRF-SPT at 33 frames/s in PMA-treated cells were used to calculate single time step mean square jump distances as a function of distance from an actin structure (solid line). For comparison, simulations of particles diffusing near a reflecting boundary with constant membrane viscosity and finite localization accuracy, modelled after the real data, were used to calculate mean square jump distances as function of distance from the reflecting boundary (dashed line).
Figure 6
Figure 6
Actin facilitates cross-link-induced immobilisation of FcεRI. (a) Cumulative probability distribution plot of diffusion coefficients for QD-IgE in the absence (solid lines) and presence (dashed lines) of latrunculin B and before (thin lines) and after (thick lines) cross-linking with DNP-BSA. (b) XY versus time plot of a single QD-IgE-FcεRI. Arrow indicates time of DNP-BSA addition. (c) Kinetics of cross-link-induced immobilisation in the presence (light grey, n=12) and absence (dark grey, n=17) of latrunculin B. Black lines are fits to the exponential decay model: D(t) = Doe(-t/τ), where D is the instantaneous diffusion coefficient and τ is the decay constant.

Similar articles

Cited by

References

    1. Dustin ML, Cooper JA. The immunological synapse and the actin cytoskeleton: molecular hardware for T cell signaling. Nat. Immunol. 2000;1:23–9. - PubMed
    1. Lidke DS, Lidke KA, Rieger B, Jovin TM, Arndt-Jovin DJ. Reaching out for signals: filopodia sense EGF and respond by directed retrograde transport of activated receptors. J. Cell. Biol. 2005;4:619–26. - PMC - PubMed
    1. Zhang J, et al. Characterizing the topography of membrane receptors and signaling molecules from spatial patterns obtained using nanometer-scale electron-dense probes and electron microscopy. Micron. 2006;1:14–34. - PubMed
    1. Boniface JJ, et al. Initiation of signal transduction through the T cell receptor requires the multivalent engagement of peptide/MHC ligands [corrected]. Immunity. 1998;4:459–66. - PubMed
    1. Kraft S, Kinet JP. New developments in FcepsilonRI regulation, function and inhibition. Nat. Rev. Immunol. 2007;5:365–78. - PubMed

Publication types