Comparative Study
. 2008 Aug 12;47(32):8378-85.
doi: 10.1021/bi8008032. Epub 2008 Jul 19.

Characterization of the peptidoglycan of vancomycin-susceptible Enterococcus faecium

Affiliations
Comparative Study

Characterization of the peptidoglycan of vancomycin-susceptible Enterococcus faecium

Gary J Patti et al. Biochemistry. .

Abstract

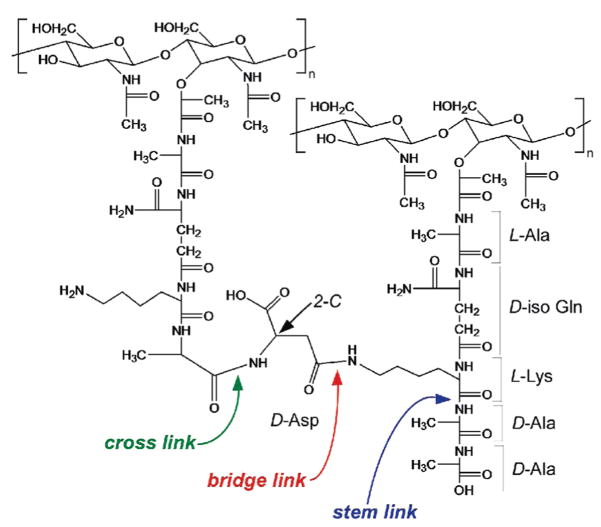
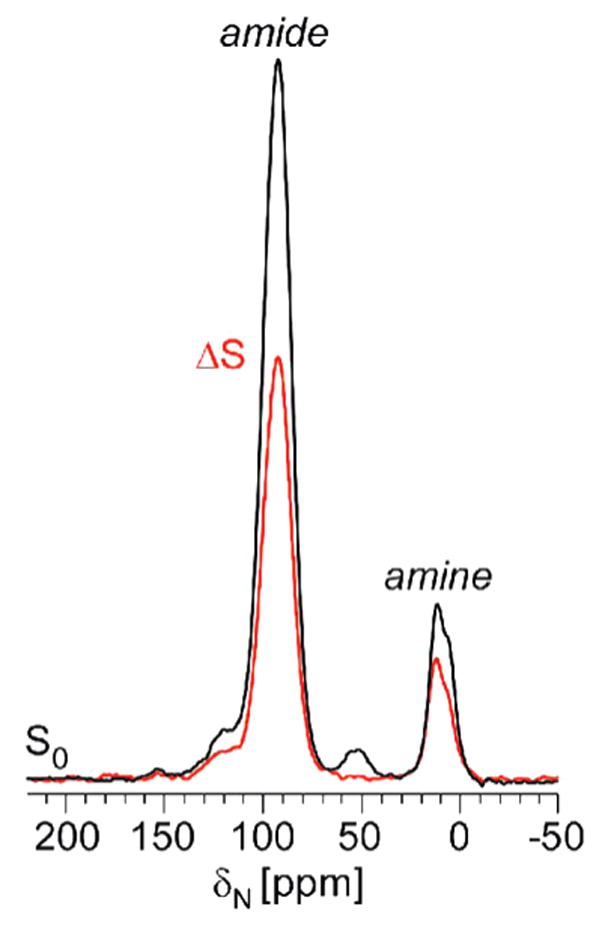
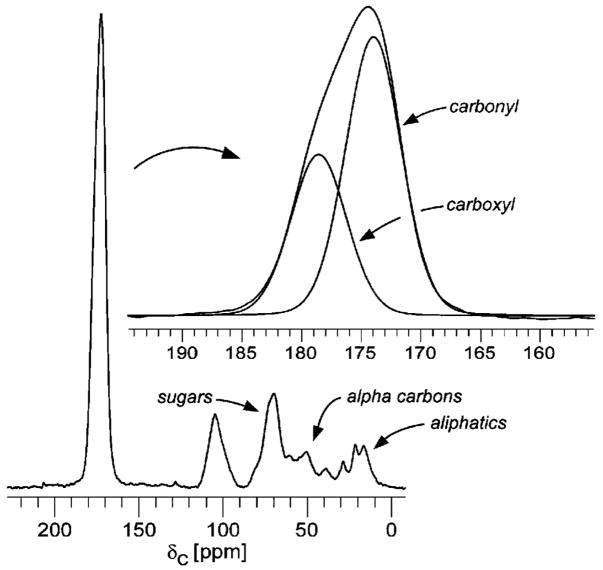
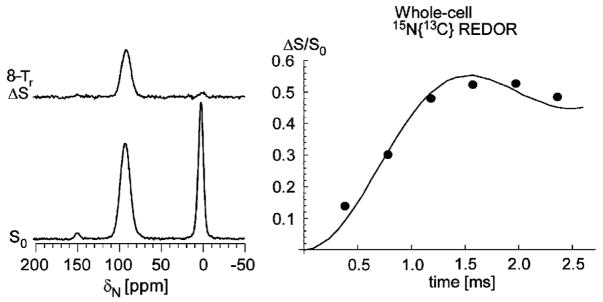
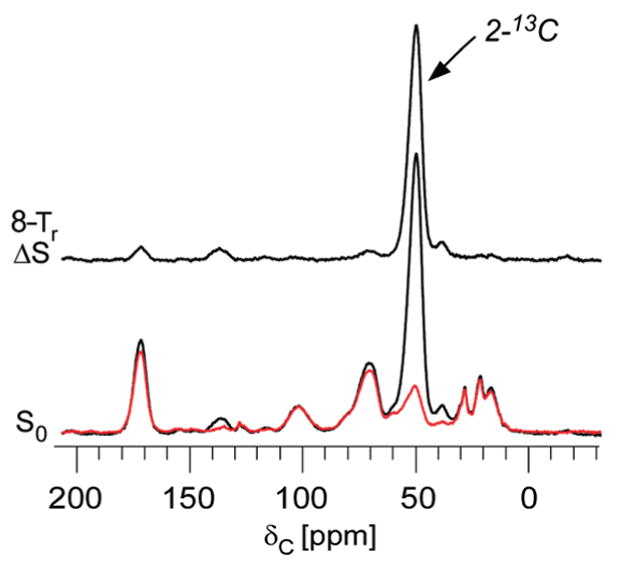
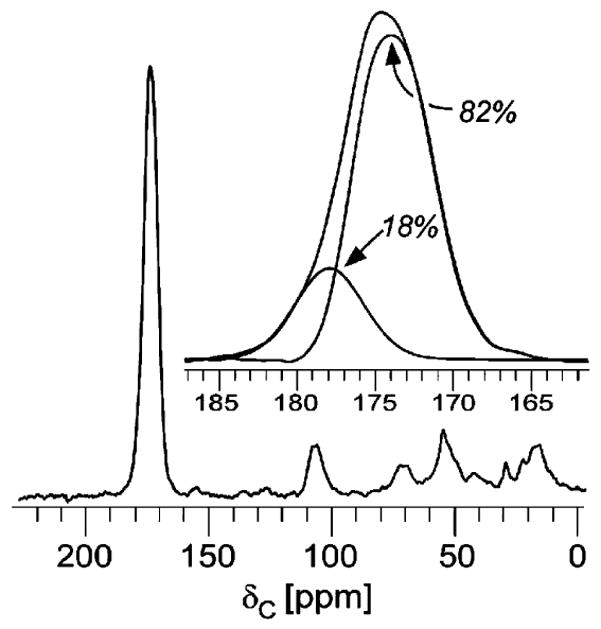
Vancomycin and other antibacterial glycopeptide analogues target the cell wall and affect the enzymatic processes involved with cell-wall biosynthesis. Understanding the structure and organization of the peptidoglycan is the first step in establishing the mode of action of these glycopeptides. We have used solid-state NMR to determine the relative concentrations of stem-links (64%), bridge-links (61%), and cross-links (49%) in the cell walls of vancomycin-susceptible Enterococcus faecium (ATTC 49624). Furthermore, we have determined that in vivo only 7% of the peptidoglycan stems terminate in d-Ala- d-Ala, the well-known vancomycin-binding site. Presumably, d-Ala- d-Ala is cleaved from uncross-linked stems in mature peptidoglycan by an active carboxypeptidase. We believe that most of the few pentapeptide stems ending in d-Ala- d-Ala occur in the template and nascent peptidoglycan strands that are crucial for cell-wall biosynthesis.


Figures

Figure 1
Figure 1
Chemical structure of the peptidoglycan of E. faecium. The repeat unit on the right is stem-linked and bridge-linked, but not cross-linked. The repeat unit on the left is stem-linked and cross-linked, but not bridge-linked. D-Asp may be amidated.
Figure 2
Figure 2
15N CPMAS echo-spectrum of cell-wall isolates enriched with L-[6-15N]lysine. The amide peak at 95 ppm occurs when lysine forms a bridge-link, and the amine peak at 5 ppm is from lysine that is not bridge-linked. The ratio of the peaks shows that 61% of stems are bridge-linked. The peak at 151 ppm may be the result of a cyclic imide involving the side chain of lysine.
Figure 3
Figure 3
15N{13C} REDOR spectra after 8-Tr evolution time of E. faecium cell-wall isolates enriched with D,L-[15N, 2-13C]aspartic acid. Bridges that are cross-linked form amides, and those that do not remain amines. Nitrogen label that was scrambled by aminotransferase does not dephase after 8 Tr. The full-echo spectrum is in black and the REDOR difference in red. Eighty-three percent of bridges are cross-linked, as determined by the relative integrated intensities of the amide and amine peaks of the REDOR difference spectrum.
Figure 4
Figure 4
One-liter growths of E. faecium in the presence and absence of alaphosphin, an alanine racemase inhibitor. Alaphosphin was added every 1.5 h of growth at 5 μg/mL. E. faecium cannot survive in the presence of alaphosphin without exogenous D-Ala.
Figure 5
Figure 5
13C CPMAS echo spectrum of cell-wall isolates enriched with L-[1-13C]lysine. The carbonyl-carbon peak is deconvoluted into two components, a 178-ppm carboxyl peak and a 174-ppm carbonyl-carbon peak (inset). The line shape of the 174-ppm peak was determined by REDOR (see Figure 6, top inset). The ratio of the two peak intensities shows that 64% of L-lysine is stem-linked.
Figure 6
Figure 6
(Left) 13C{15N} REDOR spectra after 8-Tr evolution time for cell walls isolated from whole cells labeled with L-[1-13C]lysine and D-[15N]alanine, grown in the presence of alaphosphin. The full-echo spectrum (S0) is shown at the bottom of the figure and the REDOR difference (ΔS) at the top. The carbonyl region of the full-echo spectrum is deconvoluted in the lower inset, showing the fraction of stem-linked lysine at 174 ppm. The REDOR difference of the top inset (same expanded scale) provided the line shape for the 174-ppm component of the deconvolution. (Right) 13C{15N} REDOR dephasing (ΔS/S0) of the 174-ppm component of the carbonyl-carbon peak as a function of dipolar evolution time. The maximum one-bond dephasing shows the isotopic enrichment of D-[15N] alanine is 64%. The enrichment of D-[15N] alanine is independent of stem-linking; the fact that 64% of the PG in cell-wall isolates is stem-linked is a coincidence.
Figure 7
Figure 7
(Left) 15N{13C} REDOR spectra after 8-Tr evolution time for cell-wall isolates enriched with L-[6-15N]lysine and D,L-[4-13C] aspartic acid, grown in the presence of alaphosphin. (Right) 15N{13C} REDOR dephasing (ΔS/S0) of the 95-ppm peak as a function of dipolar evolution time. The maximum one-bond dephasing shows that the isotopic enrichment of D,L-[4-13C]aspartic acid is 55%.
Figure 8
Figure 8
13C {15N} REDOR spectra for cell-wall isolates enriched with D,L-[2-13C, 15N]aspartic acid. The alpha-carbon peak near 50 ppm has approximately the same intensity as that of a natural-abundance aliphatic-carbon peak (see Figure 5). The dephased spectrum, S (bottom, red), is superimposed on S0 (bottom, black) to illustrate that dephasing reaches natural-abundance levels at 8 Tr. The total dephasing verifies that the enrichment of 15N in aspartic acid is equal to that of 4-13C in aspartic acid, which is the same as that of 2-13C (55%, see Figure 7).
Figure 9
Figure 9
13C CPMAS echo spectrum of whole cells enriched with L-[1-13C]lysine. The carboxyl lysine peak at 178 ppm is unique to the cell wall, and its intensity can be determined by deconvolution using the line shape obtained from cell-wall isolates (inset). The lysine carboxyl termini represent 18% of the peak intensity, with stem-linked PG and cytoplasmic proteins accounting for the remaining 82%.
Figure 10
Figure 10
(Left) 13C{15N} REDOR spectra after 8-Tr evolution time for whole cells enriched with L-[1-13C]lysine and D-[15N]alanine, grown in the presence of alaphosphin. Only stem-linked lysyl carbonyl carbons in PG dephase after 8 Tr. (Right) 13C{15N} REDOR dephasing (ΔS/S0) of the total carbonyl-carbon peak as a function of dipolar evolution time. The maximum one-bond dephasing is 19%.
Figure 11
Figure 11
(Left) 13C{15N} REDOR spectra after 8-Tr evolution time for whole cells enriched with D-[1-13C]alanine and D,L-[15N]aspartic acid, grown in the presence of alaphosphin. The REDOR difference spectrum, ΔS, represents only D-Ala cross-linked to D-Asp. (Right) 13C{15N} REDOR dephasing (ΔS/S0) of the 175-ppm peak as a function of dipolar evolution time. The maximum one-bond dephasing is 24%.
Figure 12
Figure 12
Complete experimental deconvolution of the carbonyl-carbon 13C spectrum of whole cells enriched with D-[1-13C]alanine and D,L-[15N]aspartic acid grown in the presence of alaphosphin. The percentages show the distribution of D-Ala in E. faecium cell walls (see text).
Figure 13
Figure 13
Two-dimensional schematic representation of proposed template model of PG assembly in E. faecium. Chain extension, occurring from right to left, and cross-linking are synchronized at lipid II, which is bound to the cell-wall membrane. The template strand (red) serves to orient nascent PG (green) so that high levels of cross-linking can be achieved. Tripeptides occur in mature PG (blue), where L,D-carboxypeptidase acts on uncross-linked stems. Seven percent of all stems terminating in D-Ala-D-Ala probably occur in nascent and template PG and are crucial for cell wall assembly. Modification of these few sites and the lipid II sites could prevent some glycopeptides from binding and inhibiting PG biosynthesis.

Similar articles

Cited by

References

    1. Mainardi JL, Villet R, Bugg TD, Mayer C, Arthur M. Evolution of peptidoglycan biosynthesis under the selective pressure of antibiotics in Gram-positive bacteria. FEMS Microbiol Rev. 2008;32:386–408. - PubMed
    1. Uttley AH, Collins CH, Naidoo J, George RC. Vancomycin-resistant enterococci. Lancet. 1988;1:57–58. - PubMed
    1. Johnson AP, Uttley AH, Woodford N, George RC. Resistance to vancomycin and teicoplanin: an emerging clinical problem. Clin Microbiol Rev. 1990;3:280–291. - PMC - PubMed
    1. Kak VaC, Joseph W. Acquired Antibiotic Resistances in Enterococci. ASM Press; Washington, DC: 2002.
    1. Courvalin P. Vancomycin resistance in gram-positive cocci. Clin Infect Dis. 2006;42:S25–S34. - PubMed

Publication types

MeSH terms