. 2008 Jul 21:9:316.
doi: 10.1186/1471-2105-9-316.

PatternLab for proteomics: a tool for differential shotgun proteomics

Affiliations

PatternLab for proteomics: a tool for differential shotgun proteomics

Paulo C Carvalho et al. BMC Bioinformatics. .

Abstract

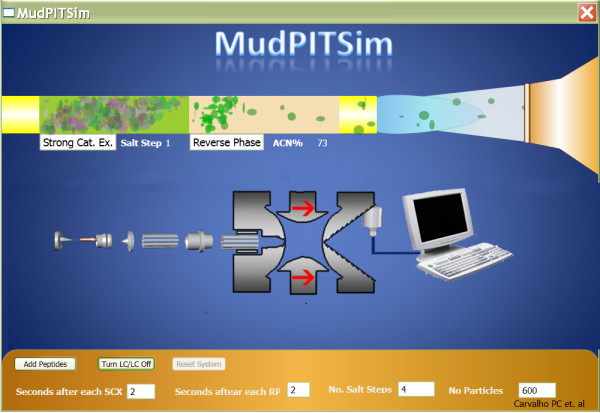
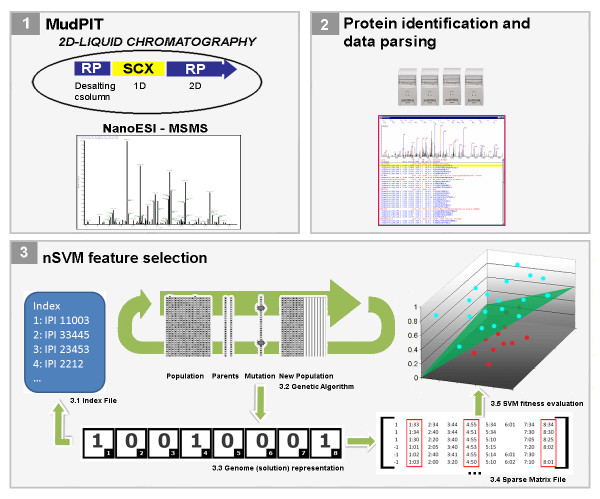
Background: A goal of proteomics is to distinguish between states of a biological system by identifying protein expression differences. Liu et al. demonstrated a method to perform semi-relative protein quantitation in shotgun proteomics data by correlating the number of tandem mass spectra obtained for each protein, or "spectral count", with its abundance in a mixture; however, two issues have remained open: how to normalize spectral counting data and how to efficiently pinpoint differences between profiles. Moreover, Chen et al. recently showed how to increase the number of identified proteins in shotgun proteomics by analyzing samples with different MS-compatible detergents while performing proteolytic digestion. The latter introduced new challenges as seen from the data analysis perspective, since replicate readings are not acquired.

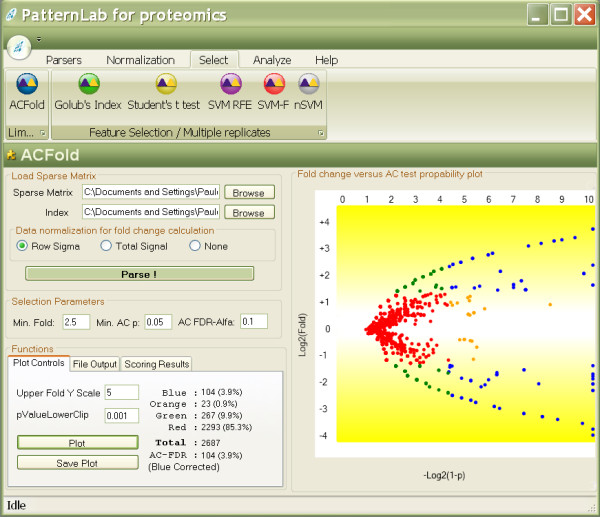
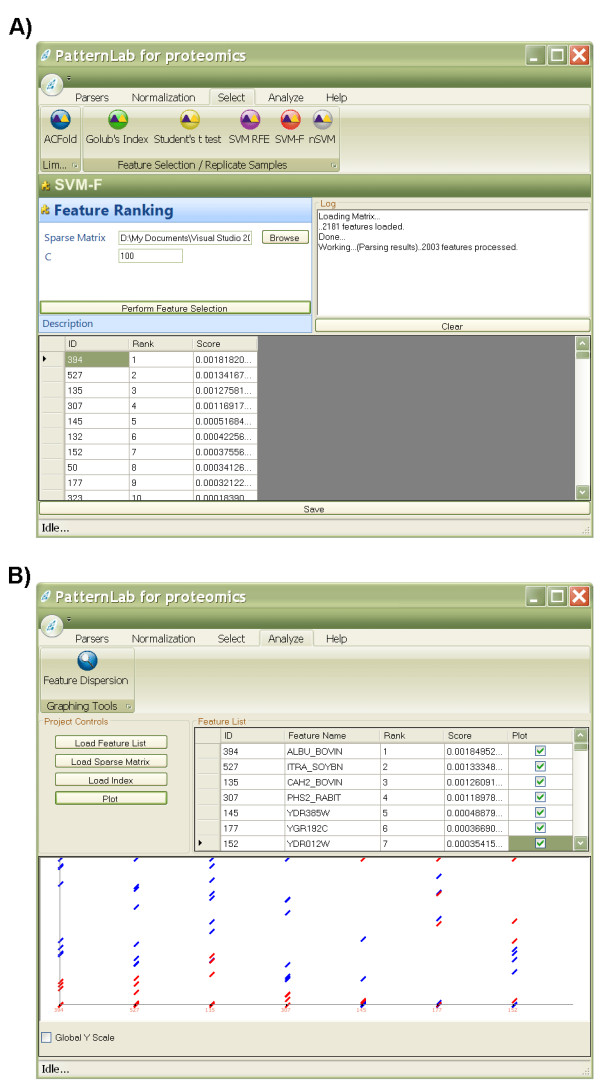
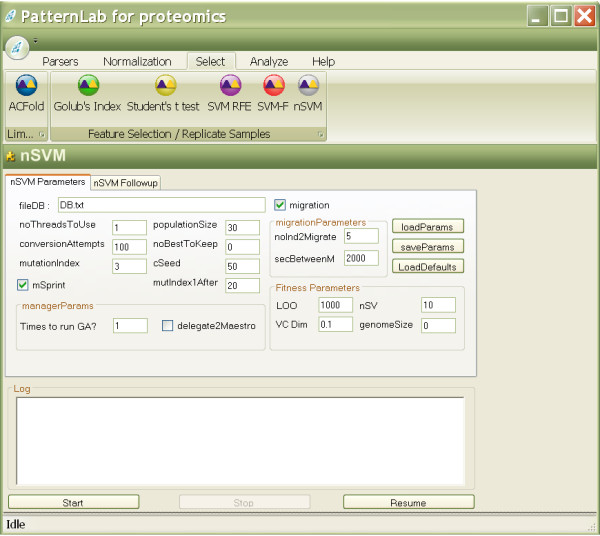
Results: To address the open issues above, we present a program termed PatternLab for proteomics. This program implements existing strategies and adds two new methods to pinpoint differences in protein profiles. The first method, ACFold, addresses experiments with less than three replicates from each state or having assays acquired by different protocols as described by Chen et al. ACFold uses a combined criterion based on expression fold changes, the AC test, and the false-discovery rate, and can supply a "bird's-eye view" of differentially expressed proteins. The other method addresses experimental designs having multiple readings from each state and is referred to as nSVM (natural support vector machine) because of its roots in evolutionary computing and in statistical learning theory. Our observations suggest that nSVM's niche comprises projects that select a minimum set of proteins for classification purposes; for example, the development of an early detection kit for a given pathology. We demonstrate the effectiveness of each method on experimental data and confront them with existing strategies.

Conclusion: PatternLab offers an easy and unified access to a variety of feature selection and normalization strategies, each having its own niche. Additionally, graphing tools are available to aid in the analysis of high throughput experimental data. PatternLab is available at http://pcarvalho.com/patternlab.


Figures

Figure 1
Figure 1
MudPIT simulator. The image displays the graphical user interface of the MudPIT simulator available on the project's website for didactic purposes. The simulator allows one to specify MudPIT parameters and then see the two-dimensional liquid chromatography simulation proceed on the fly. This is a simplification of reality; therefore, the timescale and many other features are not faithful representations. The green and pinkish structures in the upper part of the simulator represent the strong cation exchange and the reverse phase material packed in the capillary (yellow structure). The semi-conical structure represents the mass spectrometer nozzle (entrance) and the structure below is an X-Ray of a quadrupole ion trap.
Figure 2
Figure 2
ACFold's graphical user interface. The interface above displays results from real experimental data. The plot on the right shows the distribution of the identified proteins according to log2(fold change) on the ordinate (y) and – log2(1- (AC test p-value)) on the abscissa (x). The plot tab indicates that 104 proteins (blue dots) were differentially expressed because they satisfied both the AC test and fold-change cutoffs specified by the user. 23 proteins (orange dots) did not meet the fold-change cutoff but were indicated as statistically differentially expressed, therefore deserving a second look. 267 proteins (green dots) met the fold-change cutoff; however, the AC test indicated that this happened by chance. 2293 proteins (red dots) were pinpointed as not differentially expressed between classes because they failed both the AC test and the fold-change cutoffs. The GUI also lists an AC FDR indicating that all blue dots satisfy the established user-selected FDR of 0.1.
Figure 3
Figure 3
nSVM's workflow. MudPIT is applied to acquire mass spectrometry data from a biological system in different states (1). The data are subsequently identified by SEQUEST and filtered by DTASelect (2). nSVM is applied to pinpoint differences in the protein expression profiles by using a GA (3.2). Each individual's genome is an array of bits (3.3) that corresponds to a set of proteins (3.1 and 3.2) that will be selected from the dataset (3.4) to be evaluated as a solution (3.5) according to their spectral counts.
Figure 4
Figure 4
Replicate experiment analyzer's graphical user interface. This graphical user interface offers various normalization and feature selection methods (A). After applying the methods, the user can view the features ranked according to their scores. The expression from the selected feature can be graphed in the result analyzer (B).
Figure 5
Figure 5
nSVM's graphical user interface. Every aspect of nSVM's GA can be customized in its graphical user interface or programmatically. A detailed explanation of each parameter can be obtained at the project's website.

Similar articles

Cited by

References

    1. Jessani N, Niessen S, Wei BQ, Nicolau M, Humphrey M, Ji Y, Han W, Noh DY, Yates JR, 3rd, Jefferey SS, Cravatt BF. A streamlined platform for high-content functional proteomics of primary human specimens. Nat Methods. 2005;2:691–697. doi: 10.1038/nmeth778. - DOI - PubMed
    1. Washburn MP, Wolters D, Yates JR., III Large-scale analysis of the yeast proteome by multidimensional protein identification technology. Nat Biotechnol. 2001;19:242–247. doi: 10.1038/85686. - DOI - PubMed
    1. Yates JR, Cociorva D, Liao L, Zabrouskov V. Performance of a linear ion trap-Orbitrap hybrid for peptide analysis. Anal Chem. 2006;78:493–500. doi: 10.1021/ac0514624. - DOI - PubMed
    1. Katajamaa M, Oresic M. Processing methods for differential analysis of LC/MS profile data. BMC Bioinformatics. 2005;6:179. doi: 10.1186/1471-2105-6-179. - DOI - PMC - PubMed
    1. Florens L, Washburn MP, Raine JD, Anthony RM, Grainger M, Haynes JD, Moch JK, Muster N, Sacci JB, Tabb DL, Witney AA, Wolster D, Wu Y, Gardner MJ, Holder AA, Sinden RE, Yates JR, Carucci DJ. A proteomic view of the Plasmodium falciparum life cycle. Nature. 2002;419:520–526. doi: 10.1038/nature01107. - DOI - PubMed

Publication types

LinkOut - more resources