. 2008 Sep 10;314(15):2855-69.
doi: 10.1016/j.yexcr.2008.06.022. Epub 2008 Jul 8.

cAMP signaling regulates histone H3 phosphorylation and mitotic entry through a disruption of G2 progression

Affiliations

cAMP signaling regulates histone H3 phosphorylation and mitotic entry through a disruption of G2 progression

Pedro Rodriguez-Collazo et al. Exp Cell Res. .

Abstract

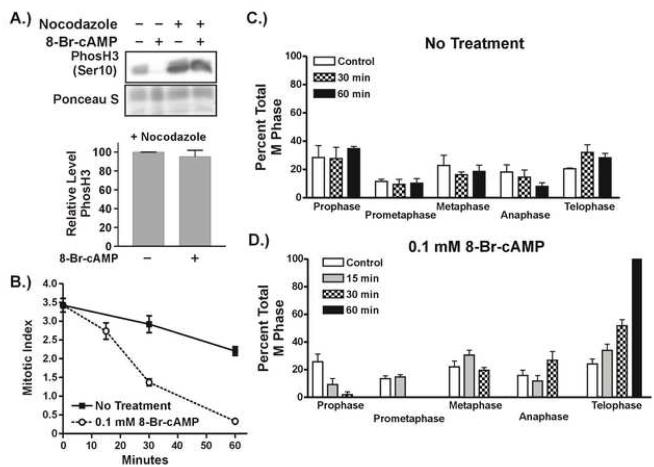
cAMP signaling is known to have significant effects on cell growth, either inhibitory or stimulatory depending on the cell type. Study of cAMP-induced growth inhibition in mammalian somatic cells has focused mainly on the combined role of protein kinase A (PKA) and mitogen-activated protein (MAP) kinases in regulation of progression through the G1 phase of the cell cycle. Here we show that cAMP signaling regulates histone H3 phosphorylation in a cell cycle-dependent fashion, increasing it in quiescent cells but dramatically reducing it in cycling cells. The latter is due to a rapid and dramatic loss of mitotic histone H3 phosphorylation caused by a disruption in G2 progression, as evidenced by the inhibition of mitotic entry and decreased activity of the CyclinB/Cdk1 kinase. The inhibition of G2 progression induced through cAMP signaling is dependent on expression of the catalytic subunit of PKA and is highly sensitive to intracellular cAMP concentration. The mechanism by which G2 progression is inhibited is independent of both DNA damage and MAP kinase signaling. Our results suggest that cAMP signaling activates a G2 checkpoint by a unique mechanism and provide new insight into normal cellular regulation of G2 progression.


Figures

Figure 1
Figure 1. cAMP signaling targets mitotic H3 phosphorylation
(A) Western blot analysis of lysates from cells treated for various times with 0.1 mM 8-Br-cAMP using antibodies against histone H3 phosphorylated at Ser10 or Thr3. (B) FACS analysis of mitotic H3 phosphorylation at Ser10. 1470.2 cells were treated with 0.1 mM 8-Br-cAMP for up to 60 minutes. Along with matched untreated controls, cell were harvested and processed for staining with antibody to phosphorylated H3 and propidium iodide. Dot plots from the 8-Br-cAMP-treated samples are shown. The boxed areas contain cells with 4N DNA content which are highly stained with the phosphorylated H3 antibody and represent cells in the early stages of mitosis. (C) Statistical analysis of the results from 3 independent FACS experiments in 1470.2, NIH3T3, and U2OS cells. 8-Br-cAMP was used at 0.1 mM and epinephrine at 1 μM. In each experiment, the percentage of cells containing high levels of H3 phosphorylation without treatment was set to 100 and the percentages of like cells at various times of 8-Br-cAMP or epinephrine treatment were expressed relative to 100. (D) Analysis of the effects of cAMP signaling on H3 phosphorylation in quiescent, non-mitotic cells. 1470.2 cells were synchronized in G0 by serum starvation and treated for various times with 1 mM 8-Br-cAMP. Acid-extracted histones were subjected to Western blotting with antibody against H3 phosphorylated at Ser10.
Figure 2
Figure 2. cAMP signaling inhibits entry of cells into mitosis
(A) 1470.2 cells were untreated or treated with nocodazole for 18 hours followed by incubation in the presence or absence of 0.1 mM 8-Br-cAMP for 1 hour. Cell lysates were subjected to Western blotting with antibody against H3 phosphorylated at Ser10. Nocodazole-treated cells were also processed for FACS analysis of mitotic H3 phosphorylation. The results from 3 independent FACS experiments are shown graphically. In each experiment the percentage of untreated cells containing mitotic levels of H3 phosphorylation was set to 100 and the value from 8-Br-cAMP-treated cells was expressed relative to 100. (B-D) cAMP signaling reduces the mitotic index and causes dramatic changes in the mitotic profile. 1470.2 cells were treated with 0.1 mM 8-Br-cAMP for up to 60 minutes. Along with matched, untreated controls, cells were processed for indirect immunofluorescence. Mitotic figures were counted and staged using staining from DAPI, phosphorylated H3, and Aurora B as benchmarks. In each experiment 1000-2000 cells were examined per treatment condition. B.) The mitotic index from untreated and 8-Br-cAMP-treated cells over time. C,D.) The percentage of cells in each stage of mitosis at the various times sampled in untreated (C) and cells treated with 0.1 mM 8-Br-cAMP (D). Graphs represent statistical analysis of results from 3 independent experiments. Error bars represent SEM.
Figure 3
Figure 3. Effects of cAMP signaling on cell cycle progression
A.) 1470.2 cells were treated with or without 0.125 mM 8-Br-cAMP. Every 2 hours cells were harvested and processed for cell cycle analysis. Results from 4 independent experiments are shown graphically. B,C.) 1470.2 cells were synchronized at G1/S by double thymidine block. Five hours after release, half the cells were treated with 0.1 mM 8-Br-cAMP. Samples were collected every hour and processed for cell cycle analysis (B) and measurement of mitotic H3 phosphorylation by FACS (C). The graphs represent results from 3-4 independent experiments. Error bars represent SEM.
Figure 4
Figure 4. cAMP signaling prevents activation of Cyclin B/Cdk1
A.) 1470.2 cells were treated with 0.1 mM 8-Br-cAMP for up to 60 minutes and harvested for preparation of whole cell lysates. Equal amounts of whole cell extract protein were separated by SDS-PAGE and subjected to Western blotting with either anti-Cyclin B or anti-cdc2 antibodies. B.) Immunoprecipitation from whole cell extracts was carried out with Cyclin B antibody. Immunoprecipitates were assayed for Cyclin B/Cdk1 kinase activity using histone H1 as a substrate. Samples were separated by SDS-PAGE and autoradiographed (inset). Statistical analysis of results from 3-4 independent experiments is shown graphically. The relative level of histone H1 phosphorylation in untreated cell extracts in the presence of the cdk inhibitor roscovitine is indicated as a dashed line. Error bars represent SEM. C,D.) Western blot analysis of lysates from cells synchronized by double thymidine block and treated with or without 0.1 mM 8-Br-cAMP at 5 hours post-release. Immunoblotting was carried out to detect total cellular Cdk1 or pCdk1(Y15) in lysates collected from 5 to 13 hours post-release (C). Bands on the western blots were detected by chemiluminescence imaging and quantitated. For each time point the ratio of pCdk1(Y15) to total Cdk1 was calculated. In each experiment the ratio at the 5 hour time point was set to 1 and all other time points were expressed relative to that. Graphic representation of the data from 3 independent experiments is shown (D). Error bars represent SEM.
Figure 5
Figure 5. Effects of cAMP signaling on CyclinA/cdk2 levels and activity
1470.2 cells were treated with various times with 0.1 mM 8-Br-cAMP. Cells were harvested and cell lysates or whole cell extracts were generated. A.) Whole cell extracts (Cyclin A) or cell lysates (cdk2) were subjected to Western blotting with antibodies against Cyclin A or cdk2. The results shown are representative of 3-4 experiments. B.) Immunoprecipitation from whole cell extracts was carried out with Cyclin A antibody. Immunoprecipitates were assayed for Cyclin A-dependent kinase activity using histone H1 as a substrate. Samples were separated by SDS-PAGE and autoradiographed (inset). Statistical analysis of results from 3-4 independent experiments is shown graphically.
Figure 6
Figure 6. cAMP-induced loss of H3 phosphorylation is independent of Epac
1470.2 cells were treated for the times indicated with 30 μM 8-CPT-2’-O-Me-cAMP or 0.1 mM N6-Phenyl-cAMP. Cell lysates were immunoblotted with antibody to H3 phosphorylated at serine 10. The data shown is representative of at least three independent experiments.
Figure 7
Figure 7. cAMP signaling regulates G2 progression and mitotic H3 phosphorylation in a PKA-dependent fashion
1470.2 cells were transfected with siRNAs specific for Lamin A/C, and the α and β isoforms of the PKA catalytic subunit in various combinations as listed above the panels in A and B. A.) Transfected cells were assayed by Western blot for Lamin A/C, PKA Cα, PKA Cβ, and HDAC1. B.) Transfected 1470.2 cells were treated with 1 mM 8-Br-cAMP or untreated. Phosphorylation of histone H3 (Ser10) and VASP (Ser239) were assayed by Western blotting with phosphorylation site-specific antibodies. Membranes were also stained with ponceau S to assess sample loading. C.) The effects of various siRNAs on VASP phosphorylation in the presence of cAMP in 1470.2 and NIH3T3 cells. In each experiment the level of cAMP-induced VASP phosphorylation measured in the presence of Lamin A/C siRNA was set to 100 and VASP phosphorylation levels in other conditions were expressed as a relative percentage. Data from three independent experiments is presented graphically. D.) Effects of siRNAs on cAMP-induced loss of H3 phosphorylation. For each experiment the level of H3 phosphorylation in the absence of cAMP treatment was set to 100 for each transfection condition and the level of H3 phosphorylation in the presence of cAMP treatment was expressed as a relative percentage. The graph represents the results from 3 independent experiments. Error bars represent SEM. nd – not determined.
Figure 8
Figure 8. Dose dependency of cAMP-regulated protein phosphorylation
1470.2 cells were treated with various concentrations of 8-Br-cAMP for 60 minutes (A) or 15 minutes (B). These treatment times coincide with the maximal effect of cAMP signaling on phosphorylation of the proteins tested. Phosphorylation of histone H3 (Ser10) and p70S6K (Thr421/Ser424) as assayed by Western blotting is shown in (A), while phosphorylation of CREB (Ser133) and VASP (Ser239) are shown in (B). The data was analyzed using GraphPad Prism software, including curve fitting and calculation of EC50 as shown in (C). The graphs include data from at least three independent experiments. Error bars represent SEM.
Figure 9
Figure 9. cAMP induced G2 arrest occurs independently of DNA damage signaling
(A) 1470.2 cells were analyzed for H2AX phosphorylation by immunofluorscence after UV irradiation or treatment with 0.1 mM 8-Br-cAMP for various times. Cells in images taken randomly were analyzed for mean nuclear intensity of staining with fluor-conjugated anti-phosH2AX(Ser139) or secondary antibody alone (background) as described in Materials and Methods. For each condition, the mean normalized nuclear intensities in each experiment were averaged and the graph represents the averages of three independent experiments. Error bars represent SEM. (B) 1470.2 cells were either UV-irradiated or treated with 0.1 mM 8-Br-cAMP for various times. Phosphorylation of total Chk1 or phosphoChk1 (Ser345) was examined by Western blotting. The inset shows representative blots and the graph represents the results of at least 3 independent experiments measuring Chk1 phosphorylation. Error bars represent SEM.
Figure 10
Figure 10. Effects of MAP kinase inhibitors on cAMP-induced loss of H3 phosphorylation
A.) Cells were treated with 10 μM U0126 for the times indicated. Cell lysates were subjected to Western blotting with antibodies against phosphorylated ERK1/2. B.) Cells were treated for the times indicated with vehicle (DMSO) alone, SB203580 (10 μM) alone, or anisomycin (50 ng/ml) in combination with either DMSO or SB230580. Cell extracts were subjected to Western blotting with an antibody against phosphorylated CREB/ATF1. C, D) Cells were treated for varying times with DMSO, 10 μM SB203580, or 10 μM U0126 alone (C) or were pretreated with these reagents for 30 minutes prior to the addition of 8-Br-cAMP (1 mM) (D). Cell extracts were subjected to Western blotting with an antibody against phosphorylated H3(Ser10). The results of at least three independent experiments were subjected to statistical analysis and are shown graphically. Error bars represent SEM.

Similar articles

Cited by

References

    1. Richards JS. New signaling pathways for hormones and cyclic adenosine 3',5'-monophosphate action in endocrine cells. Mol Endocrinol. 2001;15:209–218. - PubMed
    1. Stork PJ, Schmitt JM. Crosstalk between cAMP and MAP kinase signaling in the regulation of cell proliferation. Trends Cell Biol. 2002;12:258–266. - PubMed
    1. Houslay MD, Kolch W. Cell-type specific integration of cross-talk between extracellular signal-regulated kinase and cAMP signaling. Mol Pharmacol. 2000;58:659–668. - PubMed
    1. Tasken K, Stokka AJ. The molecular machinery for cAMP-dependent immunomodulation in T-cells. Biochem.Soc.Trans. 2006;34:476–479. - PubMed
    1. Koyama H, Bornfeldt KE, Fukumoto S, Nishizawa Y. Molecular pathways of cyclic nucleotide-induced inhibition of arterial smooth muscle cell proliferation. J.Cell Physiol. 2001;186:1–10. - PubMed

Publication types

MeSH terms