

Automated analysis of two- and three-color fluorescent Elispot (Fluorospot) assays for cytokine secretion
- PMID: 18644656
- PMCID: PMC4440339
- DOI: 10.1016/j.cmpb.2008.06.002
Automated analysis of two- and three-color fluorescent Elispot (Fluorospot) assays for cytokine secretion
Abstract
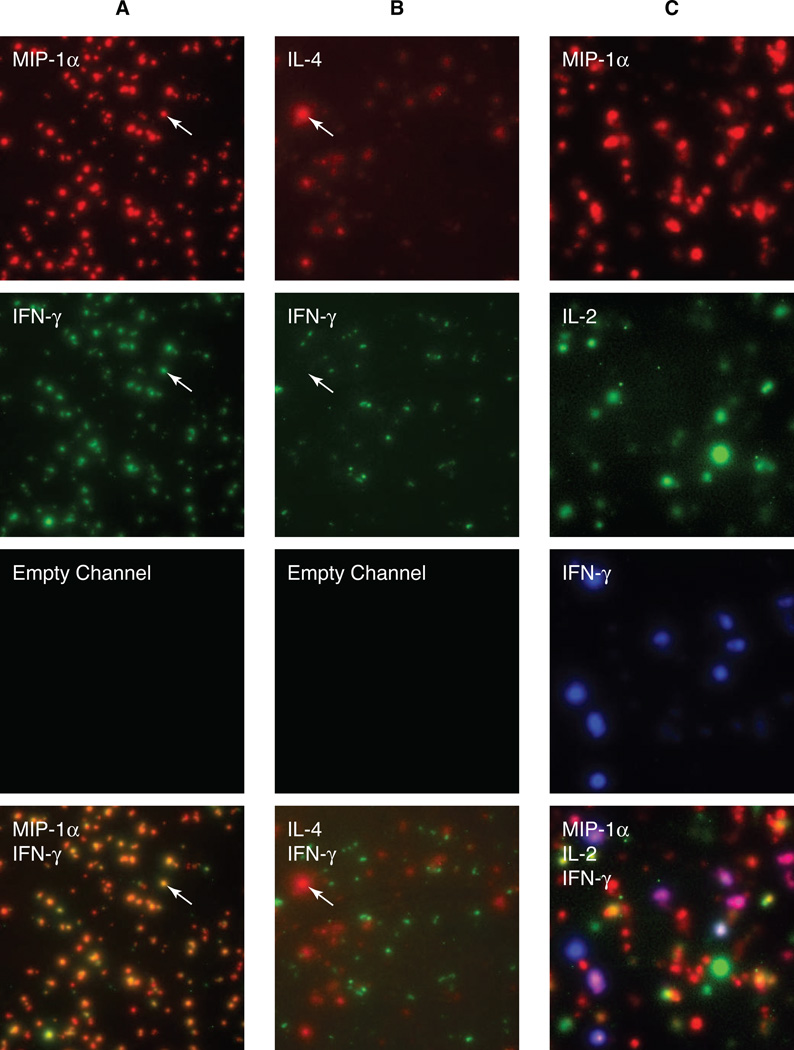
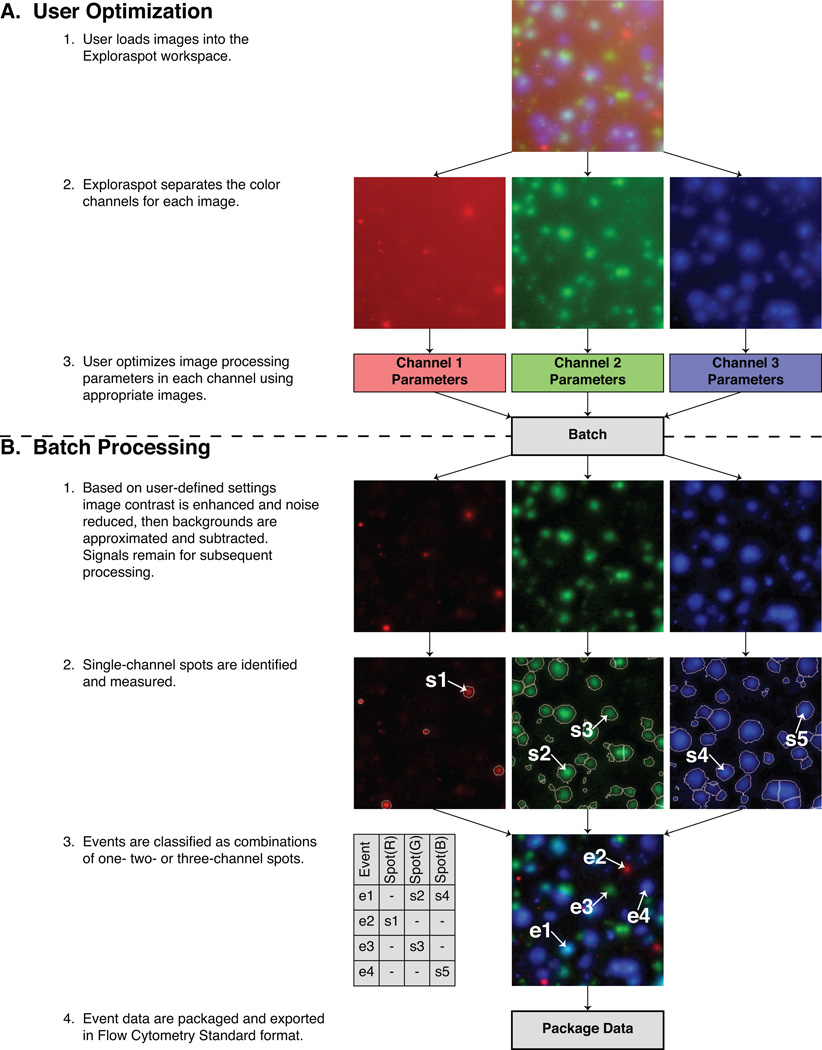
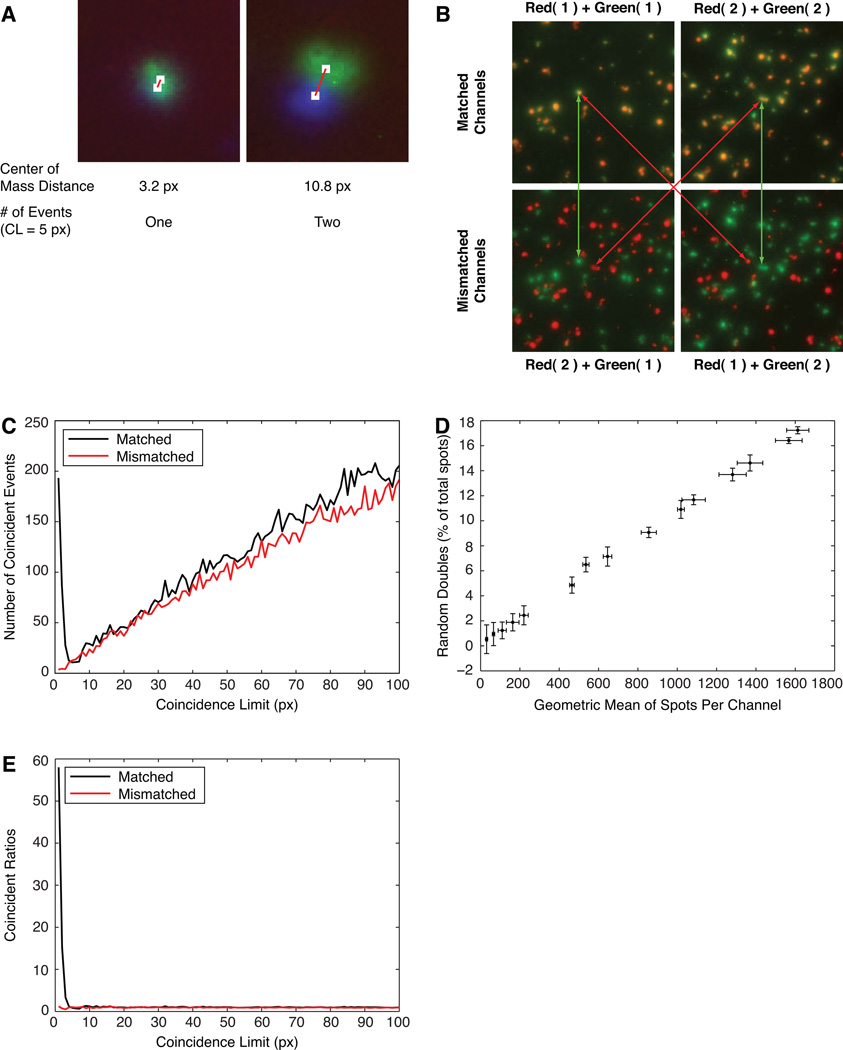
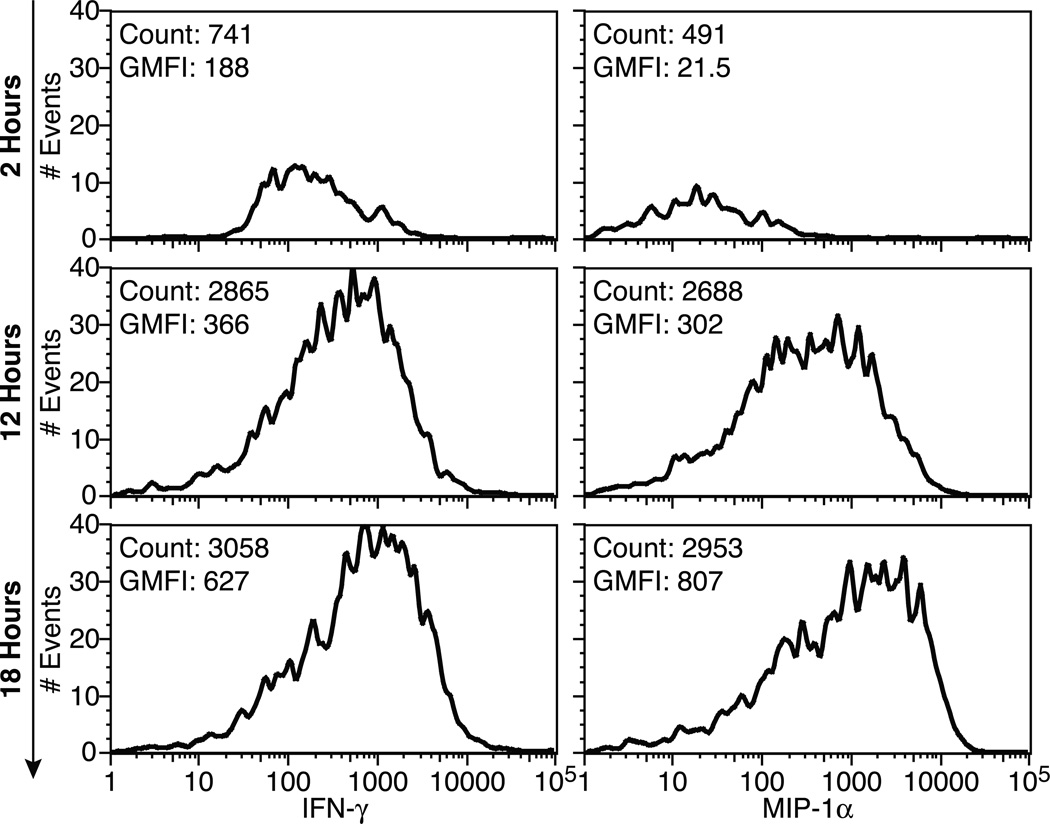
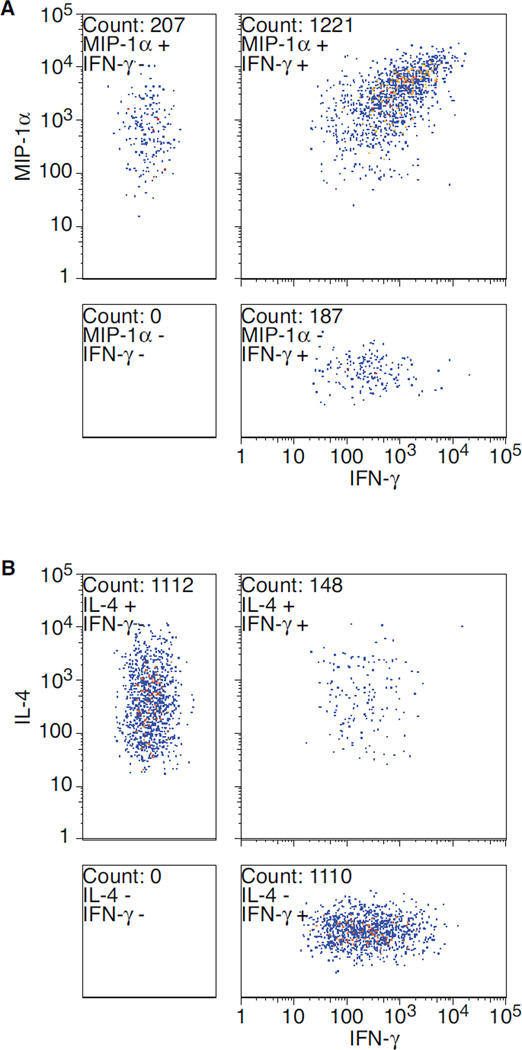
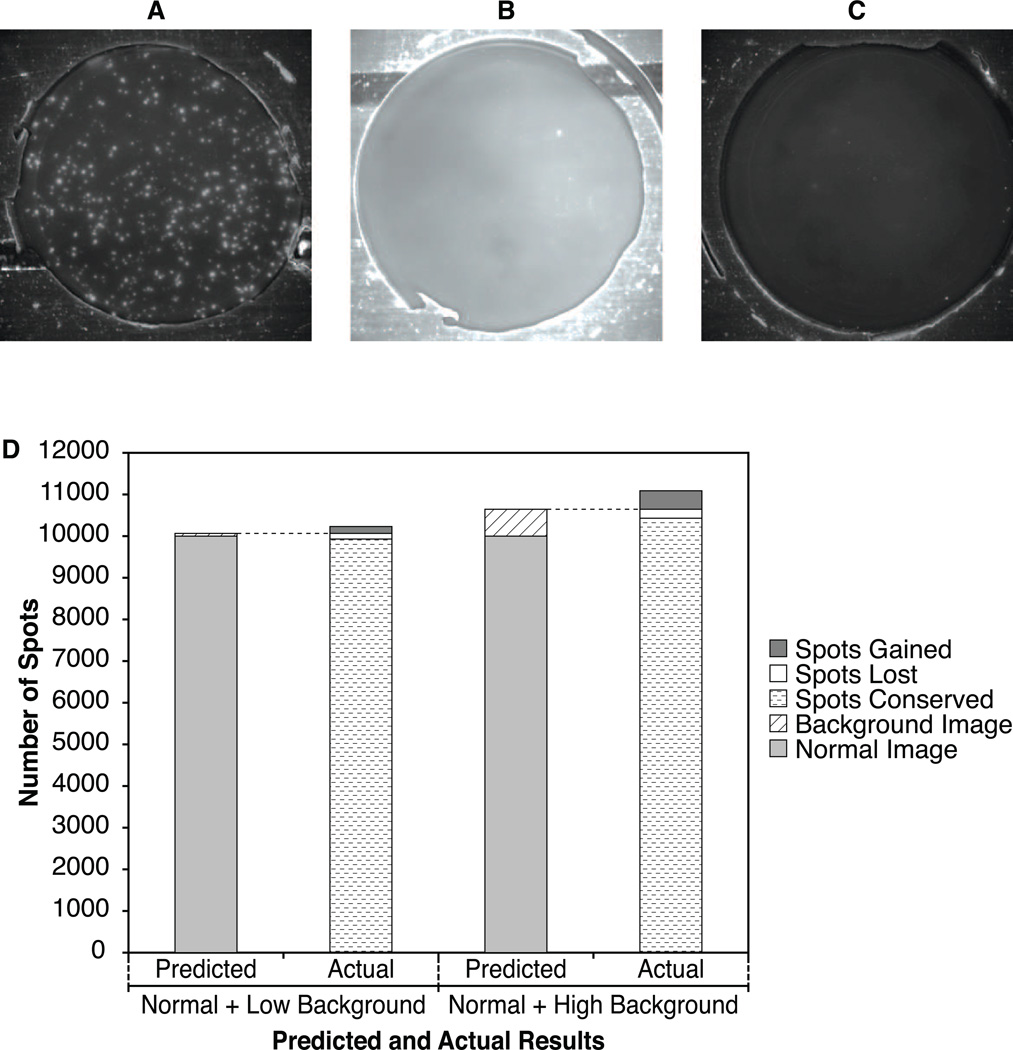
The Elispot effectively measures the frequencies of cells secreting particular molecules, especially low-frequency cells such as antigen-specific T cells. The Fluorospot assay adapted this analysis to two products per cell, and this has now been extended to three-color measurement of both mouse and human cytokine-secreting cells. Due to the increased data complexity, and particularly the need to define single-, double- and triple-producing cells, it is critical to objectively quantify spot number, size, intensity, and coincidence with other spots. An automated counting program, Exploraspot, was therefore developed to detect and quantify Fluorospots in automated fluorescence microscope images. Morphological parameters, including size, intensity, location, circularity and others are calculated for each spot, exported in FCS format, and further analyzed by gating and graphical display in popular flow cytometry analysis programs. The utility of Exploraspot is demonstrated by identification of single-, double- and triple-secreting T cells; tolerance of variable background fluorescence; and estimation of the numbers of genuine versus random multiple events.
Figures
References
-
- Quast S, Zhang W, Shive C, Kovalovski D, Ott PA, Herzog BA, Boehm BO, Tary-Lehmann M, Karulin AY, Lehmann PV. IL-2 absorption affects IFN-gamma and IL-5, but not IL-4 producing memory T cells in double color cytokine ELISPOT assays. Cell. Immunol. 2005;237(1):28–36. - PubMed
-
- Snyder JE, Bowers WJ, Livingstone AM, Lee FE, Federoff HJ, Mosmann TR. Measuring the frequency of mouse and human cytotoxic T cells by the Lysispot assay: independent regulation of cytokine secretion and short-term killing. Nat. Med. 2003;9(2):231–235. - PubMed
-
- Karulin AY, Hesse MD, Tary-Lehmann M, Lehmann PV. Single-cytokine-producing CD4 memory cells predominate in type 1 and type 2 immunity. J. Immunol. 2000;164(4):1862–1872. - PubMed
-
- Gazagne A, Claret E, Wijdenes J, Yssel H, Bousquet F, Levy E, Vielh P, Scotte F, Goupil TL, Fridman WH, Tartour E. A Fluorospot assay to detect single T lymphocytes simultaneously producing multiple cytokines. J. Immunol. Meth. 2003;283(1–2):91–98. - PubMed
-
- Divekar AA, Zaiss DM, Lee FE, Liu D, Topham DJ, Sijts AJ, Mosmann TR. Protein vaccines induce uncommitted IL-2-secreting human and mouse CD4 T cells, whereas infections induce more IFN-gamma-secreting cells. J. Immunol. 2006;176(3):1465–1473. - PubMed
Publication types
MeSH terms
Substances
Grants and funding
LinkOut - more resources
Full Text Sources
Other Literature Sources
