

Spindle checkpoint activation at meiosis I advances anaphase II onset via meiosis-specific APC/C regulation
- PMID: 18644893
- PMCID: PMC2483520
- DOI: 10.1083/jcb.200802053
Spindle checkpoint activation at meiosis I advances anaphase II onset via meiosis-specific APC/C regulation
Abstract
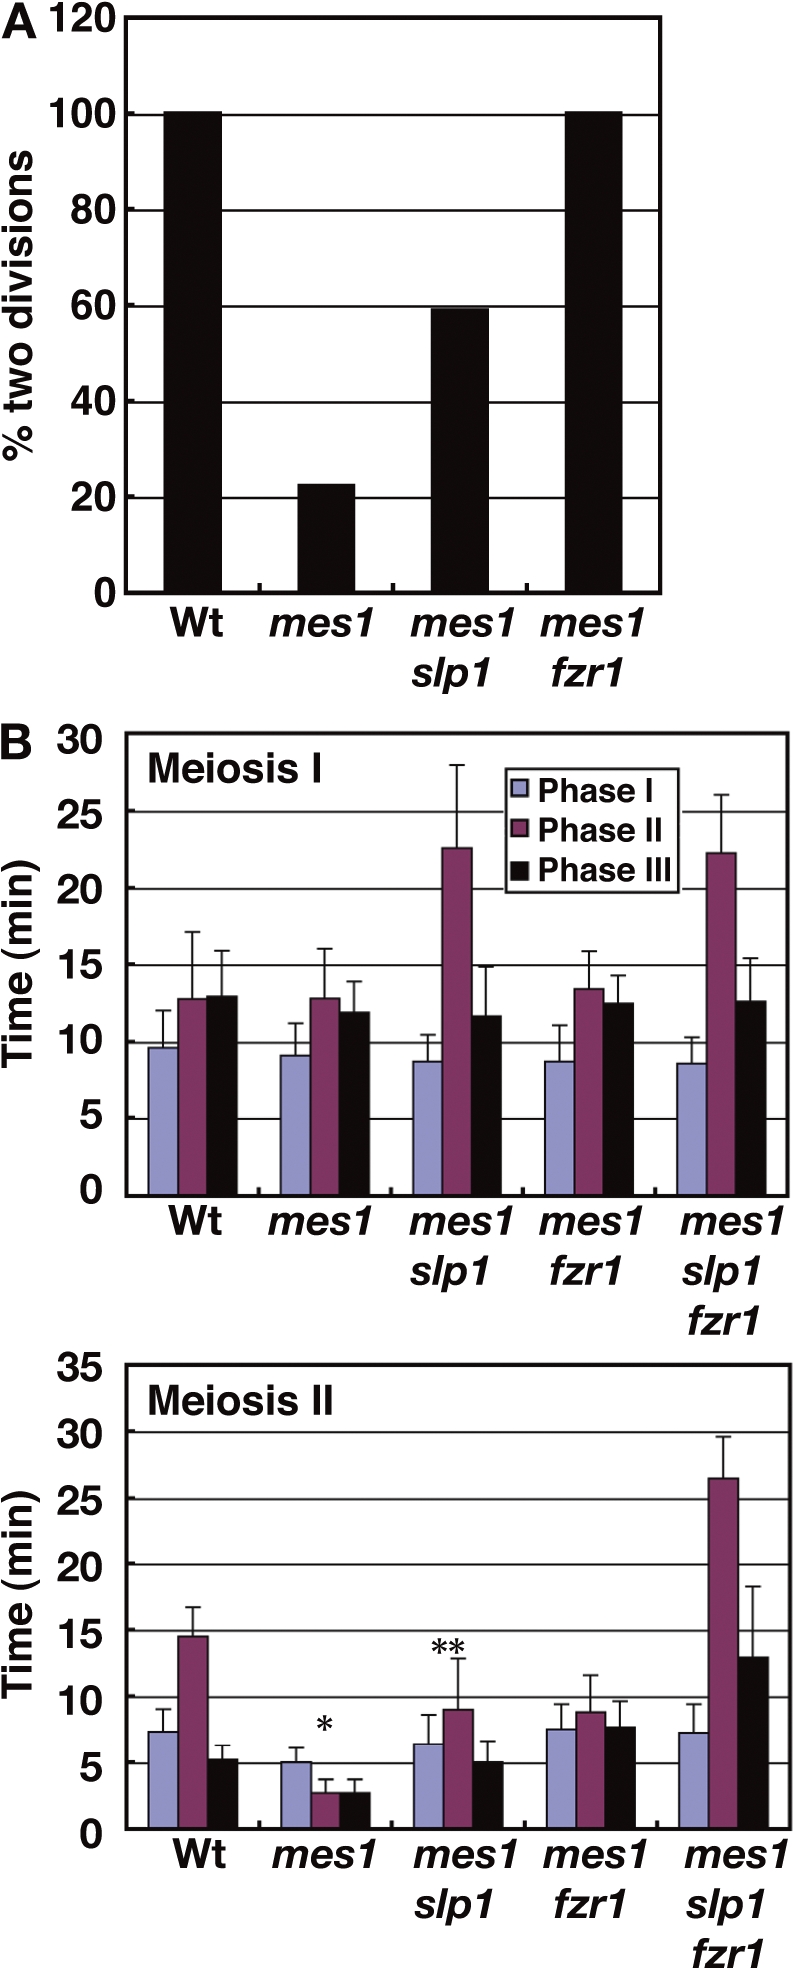
During mitosis, the spindle assembly checkpoint (SAC) inhibits the Cdc20-activated anaphase-promoting complex/cyclosome (APC/C(Cdc20)), which promotes protein degradation, and delays anaphase onset to ensure accurate chromosome segregation. However, the SAC function in meiotic anaphase regulation is poorly understood. Here, we examined the SAC function in fission yeast meiosis. As in mitosis, a SAC factor, Mad2, delayed anaphase onset via Slp1 (fission yeast Cdc20) when chromosomes attach to the spindle improperly. However, when the SAC delayed anaphase I, the interval between meiosis I and II shortened. Furthermore, anaphase onset was advanced and the SAC effect was reduced at meiosis II. The advancement of anaphase onset depended on a meiosis-specific, Cdc20-related factor, Fzr1/Mfr1, which contributed to anaphase cyclin decline and anaphase onset and was inefficiently inhibited by the SAC. Our findings show that impacts of SAC activation are not confined to a single division at meiosis due to meiosis-specific APC/C regulation, which has probably been evolved for execution of two meiotic divisions.
Figures
Similar articles
-
An E2 enzyme Ubc11 is required for ubiquitination of Slp1/Cdc20 and spindle checkpoint silencing in fission yeast.Cell Cycle. 2013 Mar 15;12(6):961-71. doi: 10.4161/cc.23946. Epub 2013 Feb 26. Cell Cycle. 2013. PMID: 23442800 Free PMC article.
-
Mes1 controls the meiosis I to meiosis II transition by distinctly regulating the anaphase-promoting complex/cyclosome coactivators Fzr1/Mfr1 and Slp1 in fission yeast.Mol Biol Cell. 2011 May;22(9):1486-94. doi: 10.1091/mbc.E10-09-0774. Epub 2011 Mar 9. Mol Biol Cell. 2011. PMID: 21389117 Free PMC article.
-
The spindle checkpoint functions of Mad3 and Mad2 depend on a Mad3 KEN box-mediated interaction with Cdc20-anaphase-promoting complex (APC/C).J Biol Chem. 2008 Aug 22;283(34):23039-47. doi: 10.1074/jbc.M803594200. Epub 2008 Jun 13. J Biol Chem. 2008. PMID: 18556659 Free PMC article.
-
Regulation of APC-Cdc20 by the spindle checkpoint.Curr Opin Cell Biol. 2002 Dec;14(6):706-14. doi: 10.1016/s0955-0674(02)00382-4. Curr Opin Cell Biol. 2002. PMID: 12473343 Review.
-
The spindle checkpoint: how do cells delay anaphase onset?SEB Exp Biol Ser. 2008;59:243-56. SEB Exp Biol Ser. 2008. PMID: 18368927 Review.
Cited by
-
Random chromosome distribution in the first meiosis of F1 disomic substitution line 2R(2D) x rye hybrids (ABDR, 4× = 28) occurs without bipolar spindle assembly.Comp Cytogenet. 2020 Oct 9;14(4):453-482. doi: 10.3897/compcytogen.v14.i4.55827. eCollection 2020. Comp Cytogenet. 2020. PMID: 33117496 Free PMC article.
-
Cuf2 boosts the transcription of APC/C activator Fzr1 to terminate the meiotic division cycle.EMBO Rep. 2013 Jun;14(6):553-60. doi: 10.1038/embor.2013.52. Epub 2013 Apr 30. EMBO Rep. 2013. PMID: 23628763 Free PMC article.
-
Klp2 and Ase1 synergize to maintain meiotic spindle stability during metaphase I.J Biol Chem. 2020 Sep 18;295(38):13287-13298. doi: 10.1074/jbc.RA120.012905. Epub 2020 Jul 28. J Biol Chem. 2020. PMID: 32723864 Free PMC article.
-
Kinetochore geometry defined by cohesion within the centromere.Nature. 2009 Apr 16;458(7240):852-8. doi: 10.1038/nature07876. Nature. 2009. PMID: 19370027
-
Effects of chromosome number reduction on mitotic and meiotic stability in fission yeast.Genome Biol. 2025 Aug 4;26(1):232. doi: 10.1186/s13059-025-03704-5. Genome Biol. 2025. PMID: 40760724 Free PMC article.
References
-
- Asakawa, H., K. Kitamura, and C. Shimoda. 2001. A novel Cdc20-related WD-repeat protein, Fzr1, is required for spore formation in Schizosaccharomyces pombe. Mol. Genet. Genomics. 265:424–435. - PubMed
-
- Blanco, M.A., L. Pelloquin, and S. Moreno. 2001. Fission yeast mfr1 activates APC and coordinates meiotic nuclear division with sporulation. J. Cell Sci. 114:2135–2143. - PubMed
-
- Buonomo, S.B., K.P. Rabitsch, J. Fuchs, S. Gruber, M. Sullivan, F. Uhlmann, M. Petronczki, A. Toth, and K. Nasmyth. 2003. Division of the nucleolus and its release of CDC14 during anaphase of meiosis I depends on separase, SPO12, and SLK19. Dev. Cell. 4:727–739. - PubMed
-
- Cervantes, M.D., J.A. Farah, and G.R. Smith. 2000. Meiotic DNA breaks associated with recombination in S. pombe.Mol. Cell. 5:883–888. - PubMed
-
- Cohen-Fix, O., J.M. Peters, M.W. Kirschner, and D. Koshland. 1996. Anaphase initiation in Saccharomyces cerevisiae is controlled by the APC-dependent degradation of the anaphase inhibitor Pds1p. Genes Dev. 10:3081–3093. - PubMed
Publication types
MeSH terms
Substances
LinkOut - more resources
Full Text Sources
Research Materials
