

Detection of targets colocalized in clutter by big brown bats (Eptesicus fuscus)
- PMID: 18647008
- PMCID: PMC2677335
- DOI: 10.1121/1.2932338
Detection of targets colocalized in clutter by big brown bats (Eptesicus fuscus)
Abstract
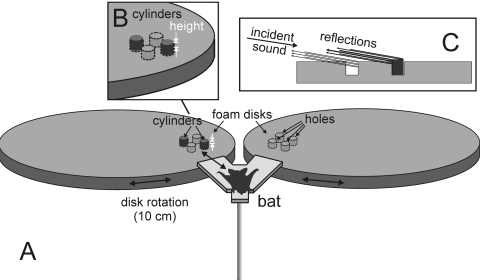
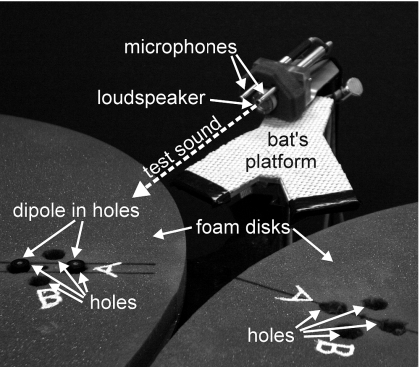
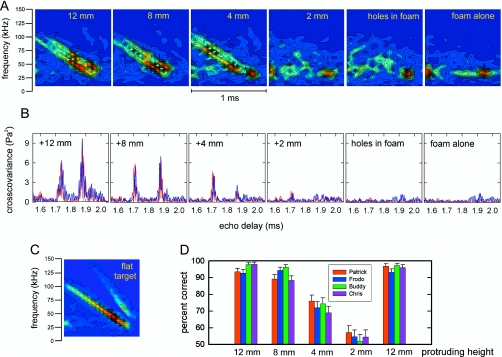
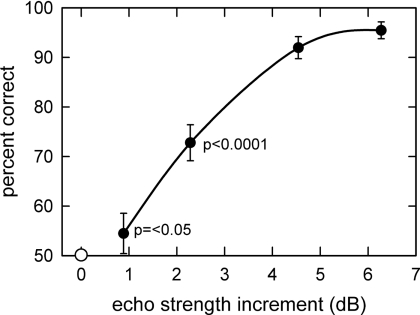
Echolocating big brown bats (Eptesicus fuscus) frequently catch insects during aerial pursuits in open spaces, but they also capture prey swarming on vegetation, and from substrates. To evaluate perception of targets on cluttered surfaces, big brown bats were trained in a two-alternative forced-choice task to locate a target, varying in height, that was embedded partway in holes (clutter) cut in a foam surface. The holes were colocalized with the possible positions of the target at distances ranging from 25 to 35 cm. For successful perception of the target, the bat had to detect the echoes contributed by the target in the same time window that contained echoes from the clutter. Performance was assessed in terms of target reflective strength relative to clutter strength in the same time window. The bats detected the target whenever the target strength was greater than 1-2 dB above the clutter.
Figures
Similar articles
-
Representation of perceptual dimensions of insect prey during terminal pursuit by echolocating bats.Biol Bull. 1996 Aug;191(1):109-21. doi: 10.2307/1543071. Biol Bull. 1996. PMID: 8776847 Review.
-
Echolocating bats adjust sonar call features and head/ear position as they track moving targets in the presence of clutter.J Acoust Soc Am. 2025 Mar 1;157(3):2236-2247. doi: 10.1121/10.0036252. J Acoust Soc Am. 2025. PMID: 40145789
-
Spatial release from simultaneous echo masking in bat sonar.J Acoust Soc Am. 2014 May;135(5):3077-85. doi: 10.1121/1.4869483. J Acoust Soc Am. 2014. PMID: 24926503
-
Spatial unmasking in the echolocating Big Brown Bat, Eptesicus fuscus.J Comp Physiol A Neuroethol Sens Neural Behav Physiol. 2009 May;195(5):463-72. doi: 10.1007/s00359-009-0424-9. Epub 2009 Mar 5. J Comp Physiol A Neuroethol Sens Neural Behav Physiol. 2009. PMID: 19263055
-
A view of the world through the bat's ear: the formation of acoustic images in echolocation.Cognition. 1989 Nov;33(1-2):155-99. doi: 10.1016/0010-0277(89)90009-7. Cognition. 1989. PMID: 2691182 Review.
Cited by
-
Effect of background clutter on neural discrimination in the bat auditory midbrain.J Neurophysiol. 2021 Nov 1;126(5):1772-1782. doi: 10.1152/jn.00109.2021. Epub 2021 Oct 20. J Neurophysiol. 2021. PMID: 34669503 Free PMC article.
References
-
- Aldridge, H., and Rautenbach, I. L. (1987). “Morphology, echolocation, and resource partitioning in insectivorous bats,” J. Anim. Ecol. JAECAP 56, 763–778.
-
- Fenton, M. B. (1995). “Natural history and biosonar signals,” in Hearing by Bats, edited by Popper A. N. and Fay R. R. (Springer-Verlag, New York: ), pp. 37–86.
-
- Fullard, J. H., Ratcliffe, J. M., and Guignion, C. (2005). “Sensory ecology of predator-prey interactions: responses of the AN2 interneuron in the field cricket, Teleogryllus oceanicus to the echolocation calls of sympatric bats,” J. Comp. Physiol., A JCPADN 191, 605–618. - PubMed
-
- Gellermann, L. M. (1933). “Chance orders of alternating stimuli in visual discrimination experiments,” J. Gen. Psychol. JGPSAY 42, 206–208.
Publication types
MeSH terms
Grants and funding
LinkOut - more resources
Full Text Sources
Miscellaneous