. 2008 Sep;9(10):1801-10.
doi: 10.1111/j.1600-0854.2008.00798.x. Epub 2008 Jul 18.

Intravital two-photon microscopy for studying the uptake and trafficking of fluorescently conjugated molecules in live rodents

Affiliations

Intravital two-photon microscopy for studying the uptake and trafficking of fluorescently conjugated molecules in live rodents

Andrius Masedunskas et al. Traffic. 2008 Sep.

Abstract

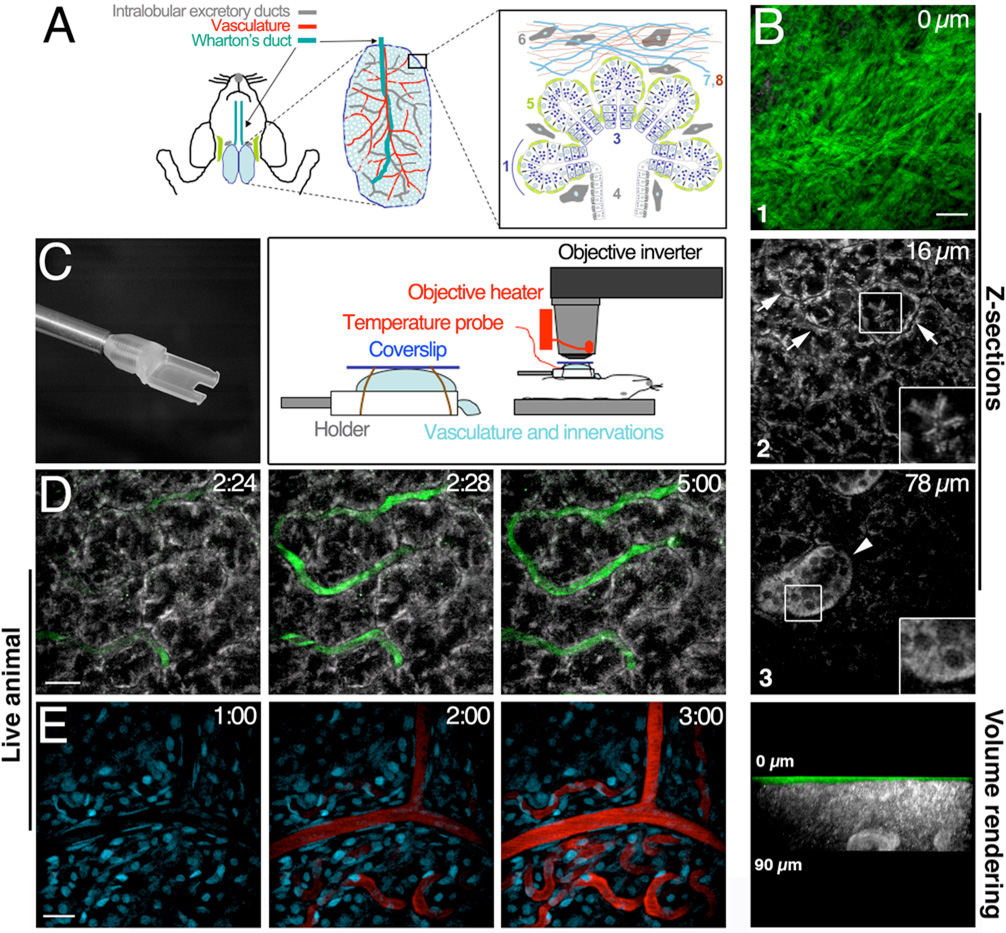
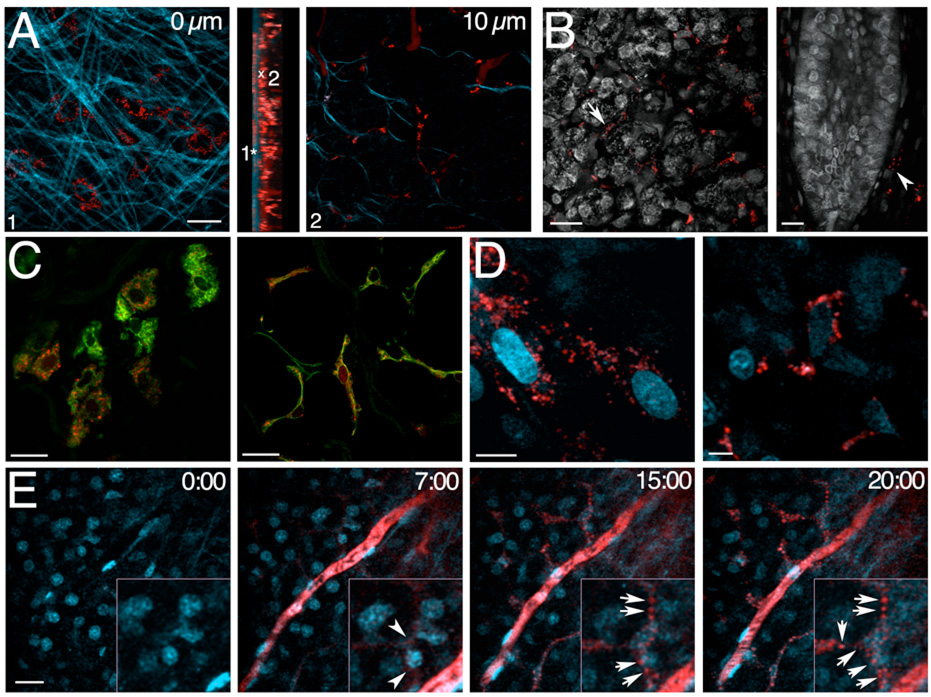
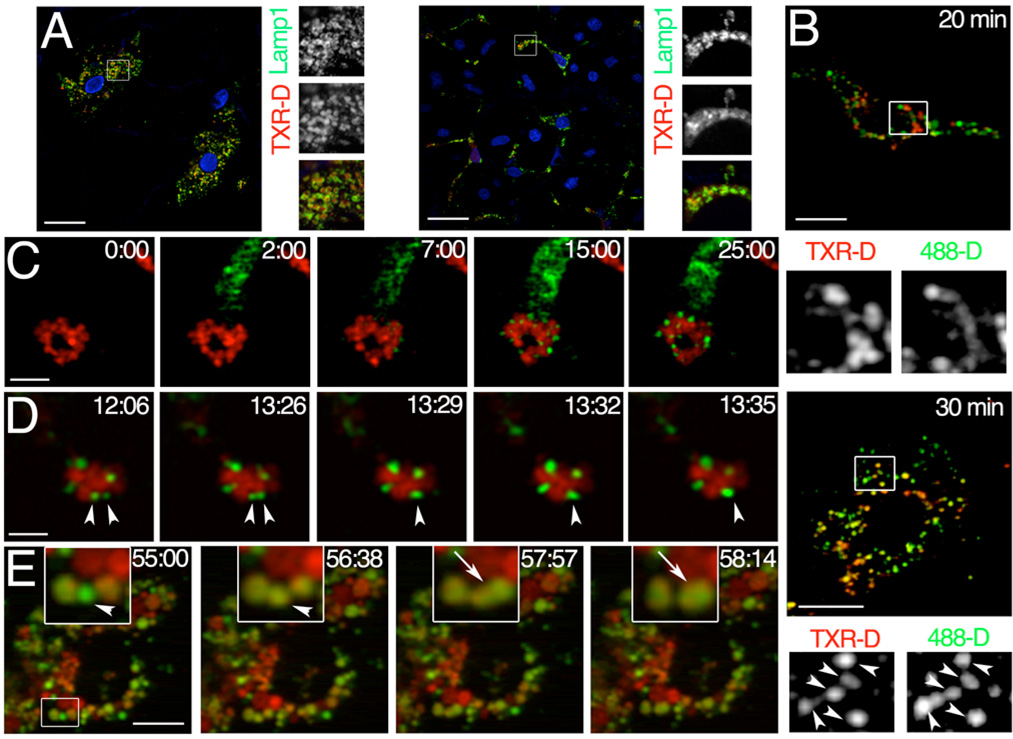
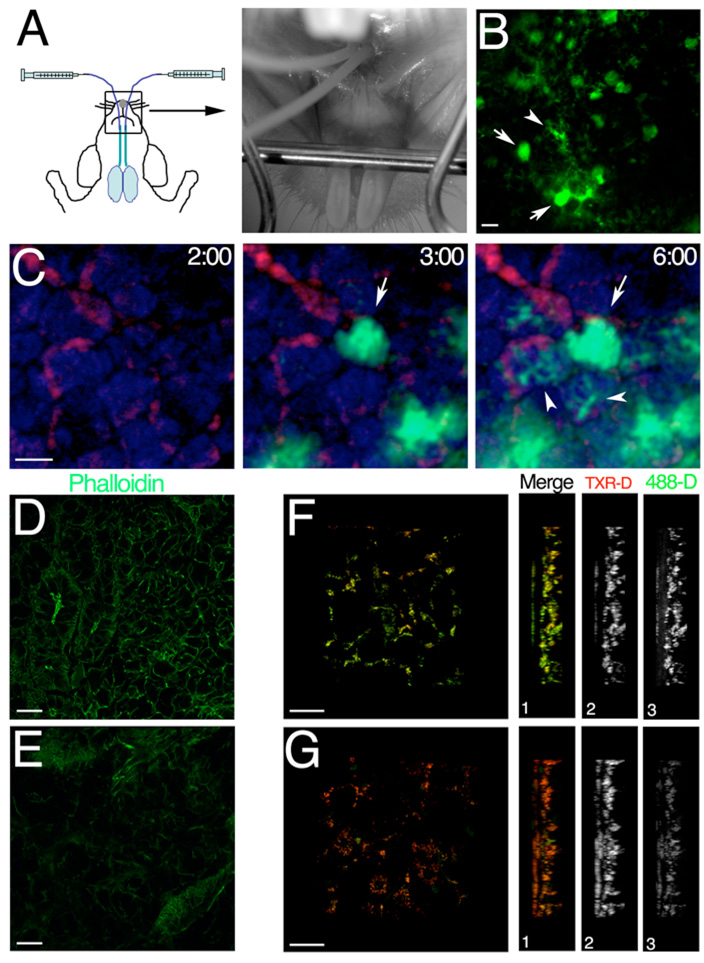
In this study, we describe an experimental system based on intravital two-photon microscopy for studying endocytosis in live animals. The rodent submandibular glands were chosen as model organs because they can be exposed easily, imaged without compromising their function and, furthermore, they are amenable to pharmacological and genetic manipulations. We show that the fibroblasts within the stroma of the glands readily internalize systemically injected molecules such as fluorescently conjugated dextran and BSA, providing a robust model to study endocytosis. We dynamically image the trafficking of these probes from the early endosomes to the late endosomes and lysosomes while also visualizing homotypic fusion events between early endosomes. Finally, we demonstrate that pharmacological agents can be delivered specifically to the submandibular salivary glands, thus providing a powerful tool to study the molecular machinery regulating endocytosis in a physiological context.


Figures

Figure 1
Figure 1. Characterization of the rat submandibular glands by TPM and SHG
A – Diagram of the rodent SSGs – The parenchyma of the SSGs is formed by acinar structures (1), which discharge secreted saliva into the acinar canaliculi (2). The contractions of the myoepithelial cells (5) facilitate the flow of the saliva first into the intercalated ducts (3) and later into the striated ducts (4), which join the interlobular ducts. The surface of the glands is covered by elastic fibers such as elastin (7) and collagen (8) and various populations of fibroblasts are scattered within the fibers and the parenchyma (6). B – Z-stacks and volume rendering of isolated rat SSGs - Z-stacks of the same area were acquired exciting first at 750 nm to image the parenchyma (grey) and then at 900 nm to image the elastic fibers (green). Acinar structures (arrows) and striated ducts (arrowhead) are also shown in the insets at a higher magnification. Lower panel - Side view of the volume rendering. C – Animal preparation – Left panel – Custom made holder designed for the SSGs. The notch has been designed to accommodate the vasculature, the Wharton’s duct and the nerve terminals. Right panel – Diagram showing the gland secured on the holder and covered with a glass coverslip. D-E - Dynamic imaging of the vasculature in rat SSGs –500 kDa FITC-D was injected in the tail artery of a rat (D) or a rat pre-injected with Hoechst 33342 (E) and imaged either at 750 nm to visualize the parenchyma of the glands (D, parenchyma grey, vasculature green) or at 800 nm to image the nuclei (E, nuclei cyan, vasculature red). Time of injection: 2’20” (D) and 1’32” (E). Bars 20 µm
Figure 2
Figure 2. Fluorescent dextrans are internalized by fibroblasts in the SSGs of live rats
A-D - Rats were injected with TXR-D either alone (A,C) or in combination with 10 Hoechst 33343 (B,D) and the isolated glands were imaged immediately (A-B, D) or fixed and processed for immuno-staining (C). A - Isolated SSGs were imaged at different depth from the surface exciting at 830 nm to highlight the elastic fibers covering the gland (cyan) and the TXR-D (red). Center panel – Volume rendering (side view). TXR-D was internalized by cells lying at the surface of the gland (1) or in the stroma surrounding the acini (2). B - Intact (left panel) or longitudinally sectioned glands (right panel) were imaged at 750 nm to highlight the parenchyma. Arrow and arrowhead point to cells that internalized dextran around the acini and a large duct respectively. C – SSGs were labeled with an antibody directed against vimentin (green) and imaged at the surface (left panel) or deeper into the gland (right panel) by confocal microscopy. D – High magnification of cells at the surface (left panel) or deeper into the gland (right panel) showing the sub-cellular distribution of internalized dextran. E - Time lapse imaging of dextran internalization in live animals - A rat was injected with Hoechst 33342, the SSGs were exposed and imaged at 830 nm (left panel – time -0:00). After 2 min and 30 sec, TXR-D was injected into the tail artery highlighting the vasculature almost instantly (see movie S5). After 4 min and 30 sec from the injection small round structures appeared inside cells adjacent to a blood vessel (time – 7:00, inset and arrowheads) which increased over time both in number (time - 15:00 min, inset and arrows) and in size (time - 20:00 inset and arrows). Bars in A,B,C and E 20 µm. Bar in D 10 µm.
Figure 3
Figure 3. Trafficking of dextran from the early endosomes to the late/endosomes lysosomes
Rats were injected with TXR-D and after 24 hours either euthanized (A) or injected with 488-D (B-E). A – SSGs were isolated, fixed and labeled with an antibody directed against Lamp1 (green) and Hoechst 33342 (blue) Images were acquired by confocal microscopy. TXR-D is localized in structures decorated by Lamp1 (insets) both in cell located at the surface (left panels) and deeper in the tissue (right panels). Bars 20 µm. B – Twenty, and 30 minutes after the injection of the 488-D, the rats were euthanized, the glands were excised and imaged. At 30 minutes but not at 20 minutes a significant co-localization between 488-D and TXR-D was observed (insets, arrowheads). Bars 10 µm. C-E – Dynamic imaging of the trafficking of dextran through the endosomal compartments of live animals. - Before the injection of 488-D the glands were exposed and imaged at 830 nm. TXR-D containing lysosomes are shown in red - C – In the first 25 minutes after the internalization, endosomes grow in size but do not fuse with lysosomes. Bars 20 µm. D - Small early endosomes undergo fusion (arrowheads). Bars 20 µm. E – After 55 min from the injection we observed a 488-D containing endosomes (time 55:00, inset arrowhead), which acquired first TXR-D (time 56:38, inset and arrowhead) and then fused with a structure containing both 488-D and TXRD (time 57:57 and 58:14, insets and arrows). Bars 10 µm.
Figure 4
Figure 4. Delivery of molecules to the rat SSGs through the Wharton’s duct
A – Cannulation of the Wharton’s duct – The rats were placed onto an adjustable stage and two thin cannulae were inserted into the Wharton’s ducts from the orifices below the tongue (right panel, arrowhead) - B-C – Injection of 488-D into the Wharton’s duct - 20 µg of 488-D were injected through the cannula into the Wharton's duct either alone (B) or in combination with 200 µg of systemically injected TXR-D (C). B – Snapshot showing the SSGs after 5 minutes after injection of 488-D. Arrows point to the cross section of large ducts, while the arrowhead points to a series of smaller ducts. - C - The SSG was exposed and imaged at 750 nm to highlight the parenchyma of the SSGs. The vasculature is shown in red. 488-D (green) appeared first in large ducts (arrows), and later in smaller ducts and acini canaliculi (arrowheads). D-G – Effect of LatA and CytD on the SSGs. TXR-D was systemically injected in a rat. After 1hr two cannulae were inserted in the Wharton’s ducts and one of the glands was injected with 10 µM LatA while the other was injected with the vehicle (control). After 45 minutes the rat received a systemic injection of 488-D and 1 hour later the animal was euthanized. First, the glands were imaged at 830 nm (F-G) and then frozen and processed for cryo-sections and immunolabeling (D-E). D, E – Both glands were sectioned, labeled with Alexa 488-phalloidin and imaged by confocal microscopy. F,G – 3D reconstructions of the first 60 µm below the surface of the glands. The levels of TXR-D (red), that was injected before Lat A, were not affected, while the amount of internalized 488-D (green) was substantially reduced (side view). Bars 20 µm

Similar articles

Cited by

References

    1. Mellman I. Endocytosis and molecular sorting. Annu Rev Cell Dev Biol. 1996;12:575–625. - PubMed
    1. Conner SD, Schmid SL. Regulated portals of entry into the cell. Nature. 2003;422(6927):37–44. - PubMed
    1. Maxfield FR, McGraw TE. Endocytic recycling. Nature reviews. 2004;5(2):121–132. - PubMed
    1. Mayor S, Pagano RE. Pathways of clathrin-independent endocytosis. Nature reviews. 2007;8(8):603–612. - PMC - PubMed
    1. Helmchen F, Denk W. Deep tissue two-photon microscopy. Nat Methods. 2005;2(12):932–940. - PubMed

MeSH terms

LinkOut - more resources