. 2009 Mar 6;6(32):293-306.
doi: 10.1098/rsif.2008.0254.

Complementary vasoactivity and matrix remodelling in arterial adaptations to altered flow and pressure

Affiliations

Complementary vasoactivity and matrix remodelling in arterial adaptations to altered flow and pressure

A Valentín et al. J R Soc Interface. .

Abstract

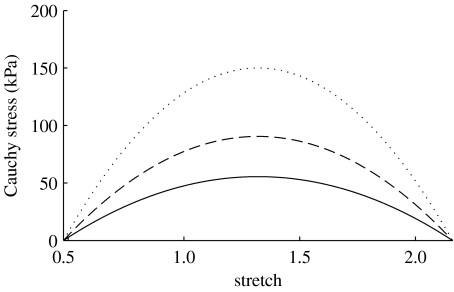
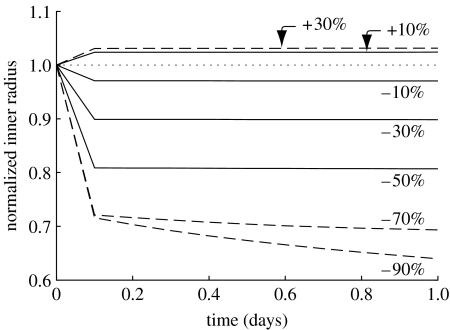
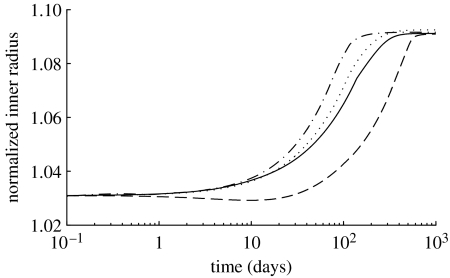
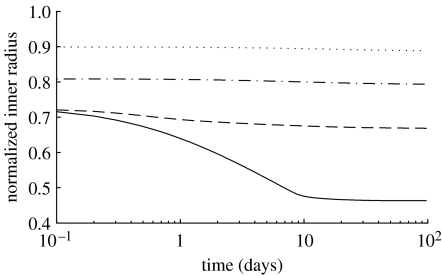
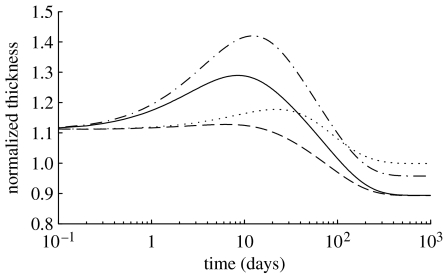
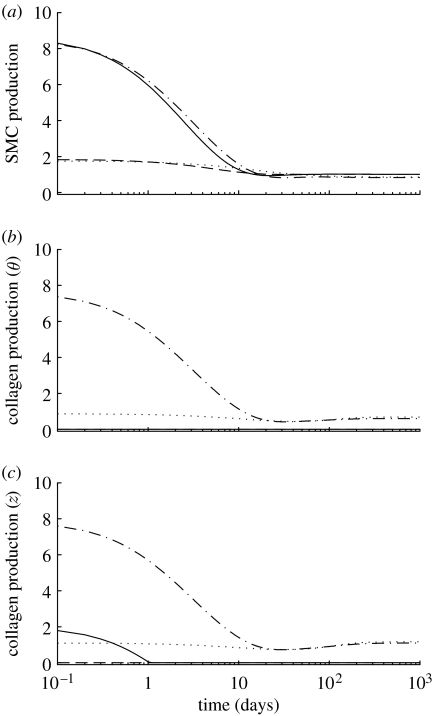
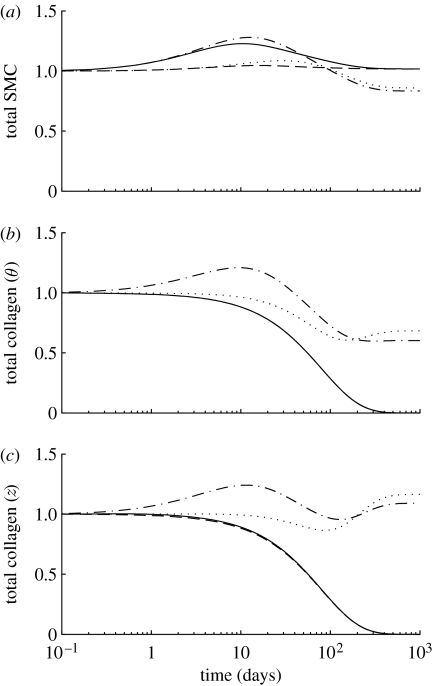
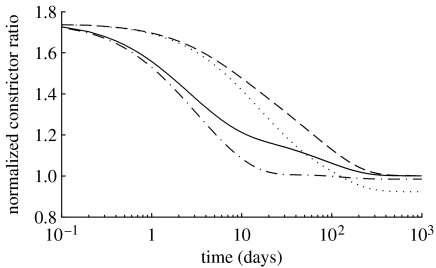
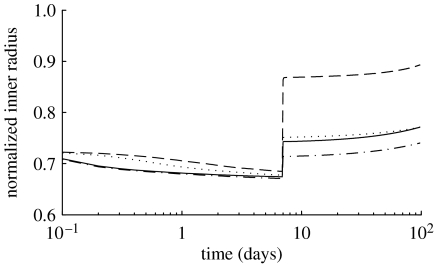
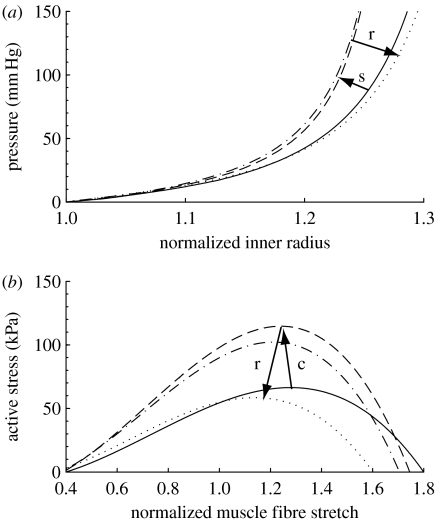
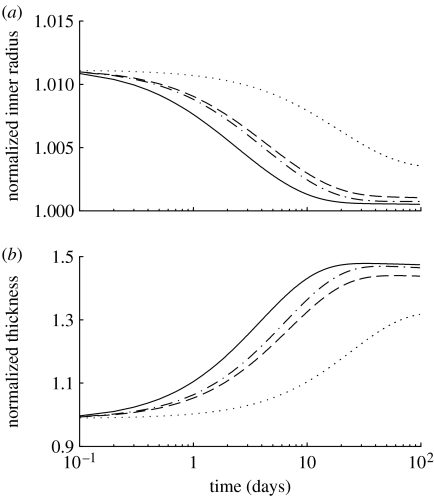
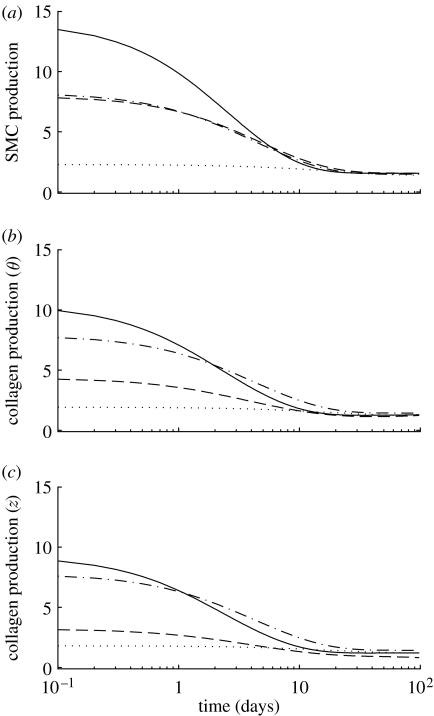
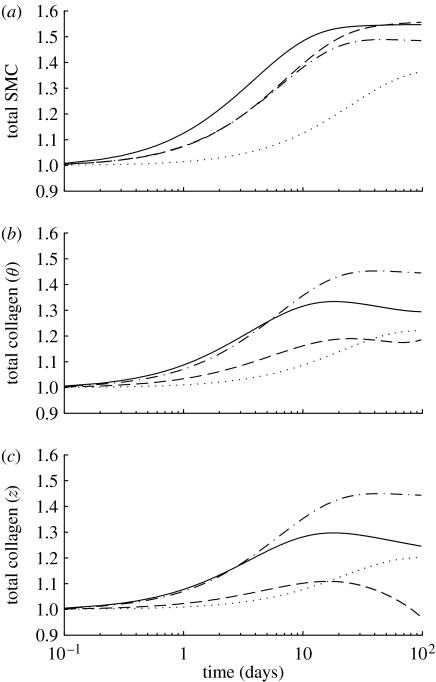
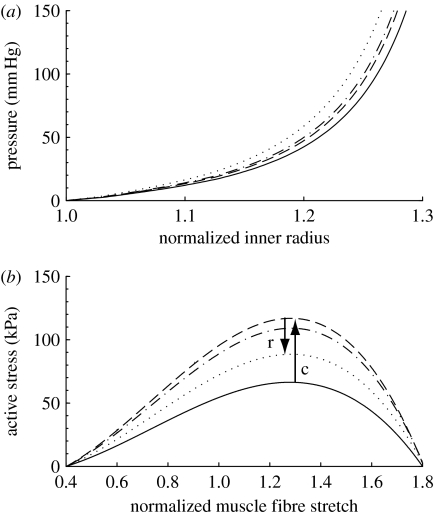
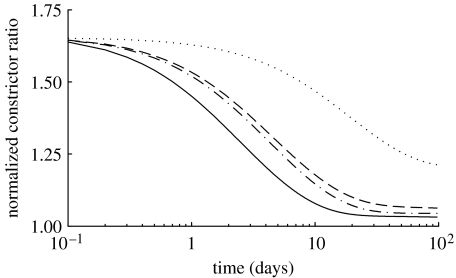
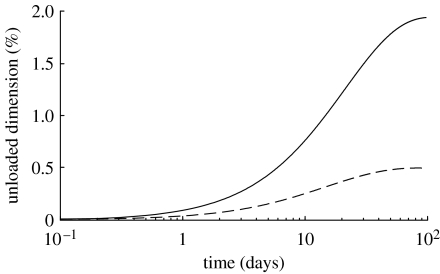
Arteries exhibit a remarkable ability to adapt to sustained alterations in biomechanical loading, probably via mechanisms that are similarly involved in many arterial pathologies and responses to treatment. Of particular note, diverse data suggest that cell and matrix turnover within vasoaltered states enables arteries to adapt to sustained changes in blood flow and pressure. The goal herein is to show explicitly how altered smooth muscle contractility and matrix growth and remodelling work together to adapt the geometry, structure, stiffness and function of a representative basilar artery. Towards this end, we employ a continuum theory of constrained mixtures to model evolving changes in the wall, which depend on both wall shear stress-induced changes in vasoactive molecules (which alter smooth muscle proliferation and synthesis of matrix) and intramural stress-induced changes in growth factors (which alter cell and matrix turnover). Simulations show, for example, that such considerations help explain the different rates of experimentally observed adaptations to increased versus decreased flows as well as differences in rates of change in response to increased flows or pressures.


Figures

Figure 1
Figure 1
Active response by smooth muscle where C=CB (solid curve), 2CB (dashed curve) and ∞ (dotted curve). Stretch is expressed with respect to the muscle's natural configuration. Increases in C result in corresponding increases in active stress for a given stretch.
Figure 2
Figure 2
Numerically instantaneous (i.e. first computational time step) constrictions and dilations for a range of flow rates (shown as ±per cent changes from Qh). Solid lines represent cases in which the instantaneous change in radius returns τw=τwh. Dashed lines represent cases for which the vessel cannot accommodate the altered flow with a single instantaneous constriction or dilation. Dotted line represents the case for which Q(s)=Qh. Note the bias towards constriction rather than dilation, which is consistent with the behaviour of cerebral arteries (Faraci 1990). Also note the clearly defined limit for maximal instantaneous constriction. One can see initial G&R governed changes for large reductions in flow rate (beyond what the vessel can accommodate instantaneously) as a gradual decrease in radius after the step change. A corresponding delayed increase in radius for the 30% increase in flow is not discernible at this short time scale. All parameters Kσk=KCk=1.
Figure 3
Figure 3
Normalized inner radius over 1000 days for 30% increases in flow where Kσk=KCk=1 (dotted line), Kσk=1 and KCk=10 (dot-dashed line), Kσk=10 and KCk=1 (dashed line) and Kσk=KCk=10 (solid line). Note the dramatically delayed dilation for the case in which Kσk>KCk. Note also that a 30% increase in flow should produce a 9% increase in calibre, which is predicted by the model.
Figure 4
Figure 4
Normalized inner radius over 100 days for 30% (dotted line), 50% (dot-dashed line), 70% (dashed line) and 90% (solid line) reductions in flow. Note the instantaneous constrictions and the marked delayed changes for the case of a 90% reduction in flow. Note also that a 90% reduction in flow should produce a 54% decrease in calibre, which is predicted by the model. All parameters Kσk=KCk=1.
Figure 5
Figure 5
Normalized wall thickness over 1000 days for a 30% reduction in flow, where Kσk=KCk=1 (dotted curve), Kσk=1 and KCk=10 (dot-dashed curve), Kσk=10 and KCk=1 (dashed curve) and Kσk=KCk=10 (solid curve). The model predicts an initial thickening as the production rate of smooth muscle increases and causes accumulation (figures 6 and 7). After the first week, however, some collagen is degraded, and the wall begins to lose mass. In all cases, wall thickness is stable after approximately 500 days, although the expected value (88% of original) is only attained for cases where Kσk>1.
Figure 6
Figure 6
Time courses of mass density production rates, normalized with respect to homeostatic rates, for (a) smooth muscle, (b) circumferentially oriented collagen and (c) axially oriented collagen for a 30% reduction in flow, where Kσk=KCk=1 (dotted line), Kσk=1 and KCk=10 (dot-dashed line), Kσk=10 and KCk=1 (dashed line) and Kσk=KCk=10 (solid line). Note the rapid (unrealistic) drop in the rate of collagen production for the cases where Kσk=10. Time courses for helical collagen (not shown) follow the same general trends as axial collagen. Note also that fold changes in production rates are within expected ranges (cf. Xu et al. 2000).
Figure 7
Figure 7
Time courses of changes in total mass, normalized with respect to homeostatic values, for (a) smooth muscle, (b) circumferentially oriented collagen and (c) axially oriented collagen for a 30% reduction in flow, where Kσk=KCk=1 (dotted line), Kσk=1 and KCk=10 (dot-dashed line), Kσk=10 and KCk=1 (dashed line) and Kσk=KCk=10 (solid line). Note the eventual (unrealistic) complete loss of collagen for the cases where Kσk=10. The time courses for helical collagen (not shown) follow the same general trends as axial collagen.
Figure 8
Figure 8
Time courses of constrictor concentration ratio C(s), normalized with respect to CB, for a 30% reduction in flow where Kσk=KCk=1 (dotted line), Kσk=1 and KCk=10 (dot-dashed line), Kσk=10 and KCk=1 (dashed line) and Kσk=KCk=10 (solid line). Note the return to baseline, but at very different rates depending on the values for the production rate parameters. This emphasizes the complex coupling between endothelial function and wall biomechanics.
Figure 9
Figure 9
Normalized inner radius over 100 days for a 70% reduction in flow at day 0 and a restoration of blood flow at day 7, where Kσk=KCk=1 (dotted line), Kσk=1 and KCk=10 (dot-dashed line), Kσk=10 and KCk=1 (dashed line) and Kσk=KCk=10 (solid line).
Figure 10
Figure 10
(a) Evolving passive ‘pressure–diameter’ curves at days 0 (solid curve), 7 (dashed curve), 14 (dot-dashed curve) and 1000 (dotted curve) for a 30% reduction in flow. All parameters Kσk=KCk=1. The abscissa ‘normalized inner radius’ is expressed as the ratio of the current deformed inner radius to the current unloaded inner radius (a(s)/A(s)). The rapid initial shift to the left indicates stiffening (s) due to gradual turnover of constituents such as collagen and resultant thickening of the vessel wall in the vasoconstricted state. The gradual rightward shift indicates passive relaxation (r) while the vessel loses mass. Note that after 1000 days, the simulated vessel is slightly more compliant than at day 0, but this would be within experimental noise. (b) Predicted shifting of the active muscle response due to G&R at days 0 (solid curve), 7 (dashed curve), 14 (dot-dashed curve) and 1000 (dotted curve), also for a 30% decrease in flow. The abscissa ‘normalized muscle fibre stretch’ is expressed as a range of values for λθm(act)(s)am(act)(s)/am(act)(0). Increasing constriction (c) occurs over the first 7 days followed by a gradual relaxation (r) as the constrictor levels return to normal.
Figure 11
Figure 11
Geometric changes over 100 days in (a) normalized radius and (b) thickness in response to a 50% increase in pressure, where Kσk=KCk=1 (dotted lines), Kσk=1 and KCk=10 (dot-dashed lines), Kσk=10 and KCk=1 (dashed lines) and Kσk=KCk=10 (solid lines). The inner radius initially increases due to the passive response to an increase in pressure, but the vessel can largely recover its inner radius within two weeks in order to restore τwh. Wall thickness increases as collagen and smooth muscle are deposited in response to increased circumferential stresses. The vessel can also attain a stable wall thickness within two weeks.
Figure 12
Figure 12
Time courses of mass density production rates, normalized with respect to the homeostatic rates, for (a) smooth muscle, (b) circumferentially oriented collagen and (c) axially oriented collagen for a 50% increase in pressure, where Kσk=KCk=1 (dotted line), Kσk=1 and KCk=10 (dot-dashed line), Kσk=10 and KCk=1 (dashed line) and Kσk=KCk=10 (solid line). Time courses for helical collagen (not shown) follow the same general trends as axial collagen.
Figure 13
Figure 13
Time courses of total mass, normalized with respect to the homeostatic masses, for (a) smooth muscle, (b) circumferentially oriented collagen and (c) axially oriented collagen for a 50% increase in pressure, where Kσk=KCk=1 (dotted line), Kσk=1 and KCk=10 (dot-dashed line), Kσk=10 and KCk=1 (dashed line) and Kσk=KCk=10 (solid line). Note the accumulation of mass for almost all fibre families. The time courses for helical collagen (not shown) follow the same general trends as axial collagen.
Figure 14
Figure 14
(a) Evolving passive ‘pressure–diameter’ curves at days 0 (solid curve), 7 (dashed curve), 14 (dot-dashed curve) and 100 (dotted curve) for a 50% increase in pressure. All parameters Kσk=KCk=1. The abscissa ‘normalized inner radius’ is expressed as the ratio of the current deformed inner radius to the current unloaded inner radius (a(s)/A(s)). The irreversible shift to the left indicates stiffening due to gradual accumulation of constituents as the vessel wall thickens in response to increased circumferential stress. (b) Predicted shifting of active muscle response due to G&R at days 0 (solid curve), 7 (dashed curve), 14 (dot-dashed curve) and 100 (dotted curve), also for a 50% increase in pressure. The abscissa ‘normalized muscle fibre stretch’ is expressed as a range of values for λθm(act)(s)am(act)(s)/am(act)(0). Note the very modest shifting of the curve, due to a correspondingly modest change in vessel radius. The maximum values for stress are related to evolving constrictor levels (see equation (2.14) and figure 15). The ‘residual’ elevation in active stress may reflect the lower NO production reported in hypertension and often referred to as ‘endothelial dysfunction’.
Figure 15
Figure 15
Time courses of constrictor concentration ratio C(s), normalized with respect to CB, for a 50% increase in pressure, where Kσk=KCk=1 (dotted line), Kσk=1 and KCk=10 (dot-dashed line), Kσk=10 and KCk=1 (dashed line) and Kσk=KCk=10 (solid line). The early vasoconstriction offsets the initial increased elastic distension (Humphrey & Wilson 2003).
Figure 16
Figure 16
Time courses of per cent changes in unloaded axial length (solid line) and unloaded inner radius (dashed line) for a 50% increase in pressure. All parameters Kσk=KCk=1.

References

    1. Baek S., Rajagopal K.R., Humphrey J.D. A theoretical model of enlarging intracranial fusiform aneurysms. J. Biomech. Eng. 2006;128:142–149. doi: 10.1115/1.2132374. - DOI - PubMed
    1. Baek S., Valentín A., Humphrey J.D. Biochemomechanics of cerebral vasospasm and its resolution: II. Constitutive relations and model simulations. Ann. Biomed. Eng. 2007;35:1498–1509. doi: 10.1007/s10439-007-9322-x. - DOI - PubMed
    1. Brownlee R.D., Langille B.L. Arterial adaptations to altered blood flow. Can. J. Physiol. Pharmacol. 1991;69:978–983. - PubMed
    1. Dajnowiec D., Langille B.L. Arterial adaptations to chronic changes in haemodynamic function: coupling vasomotor tone to structural remodelling. Clin. Sci. (Lond.) 2007;113:15–23. doi: 10.1042/CS20060337. - DOI - PubMed
    1. Dooley A., Gao B., Shi-Wen X., Abraham D.J., Black C.M., Jacobs M., Bruckdorfer K.R. Effect of nitric oxide and peroxynitrite on type I collagen synthesis in normal and scleroderma dermal fibroblasts. Free Radic. Biol. Med. 2007;43:253–264. doi: 10.1016/j.freeradbiomed.2007.04.017. - DOI - PubMed

Publication types

LinkOut - more resources