. 2008 Aug;67(8):803-18.
doi: 10.1097/NEN.0b013e3181815994.

Temporal neuropathologic and behavioral phenotype of 6neo/6neo Pompe disease mice

Affiliations

Temporal neuropathologic and behavioral phenotype of 6neo/6neo Pompe disease mice

Richard L Sidman et al. J Neuropathol Exp Neurol. 2008 Aug.

Abstract

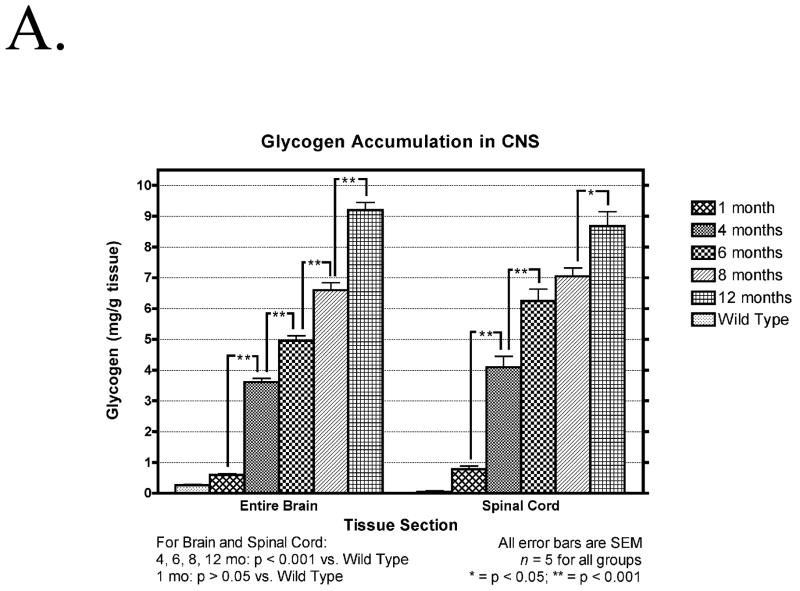
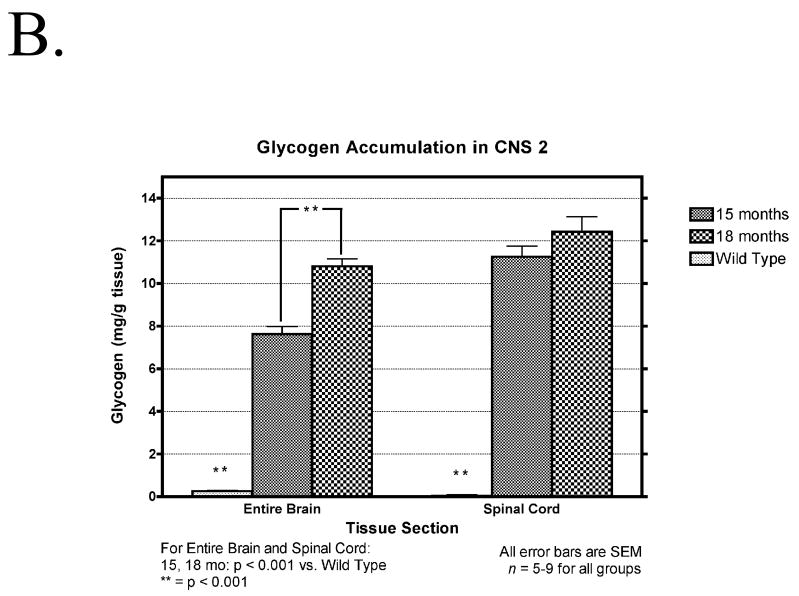
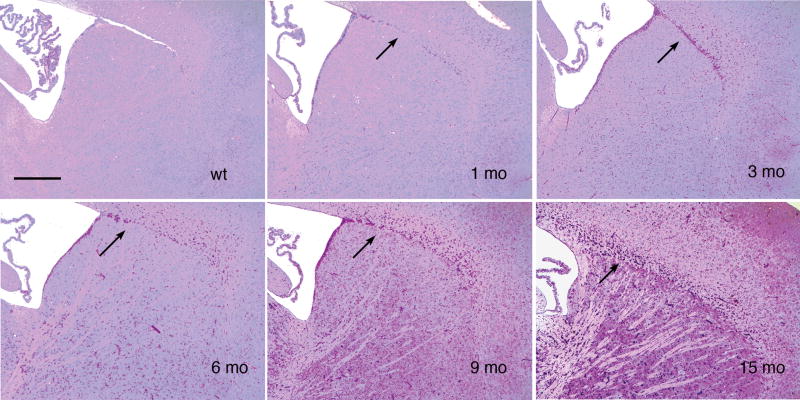
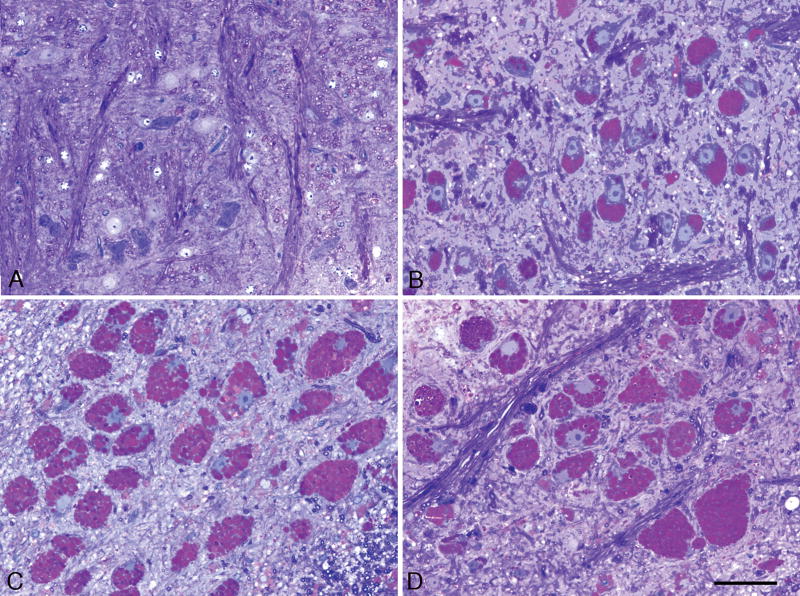
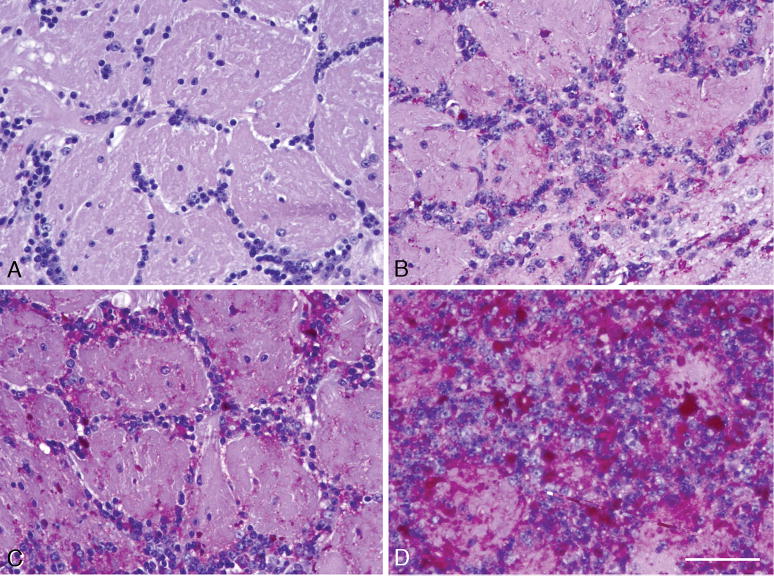
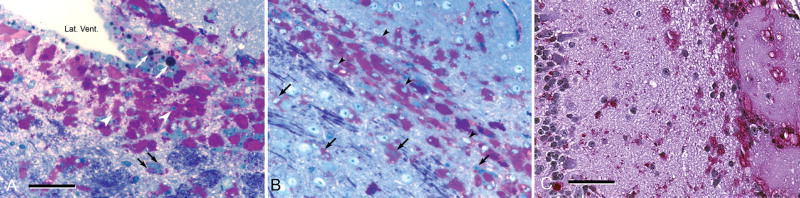
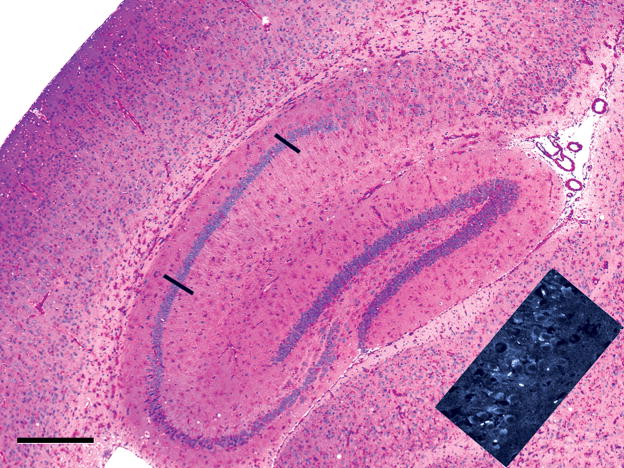
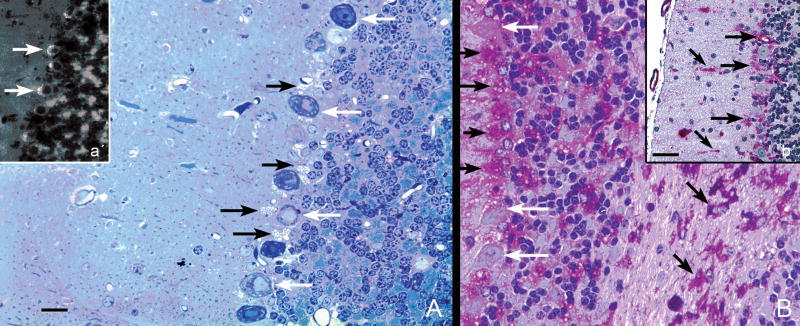
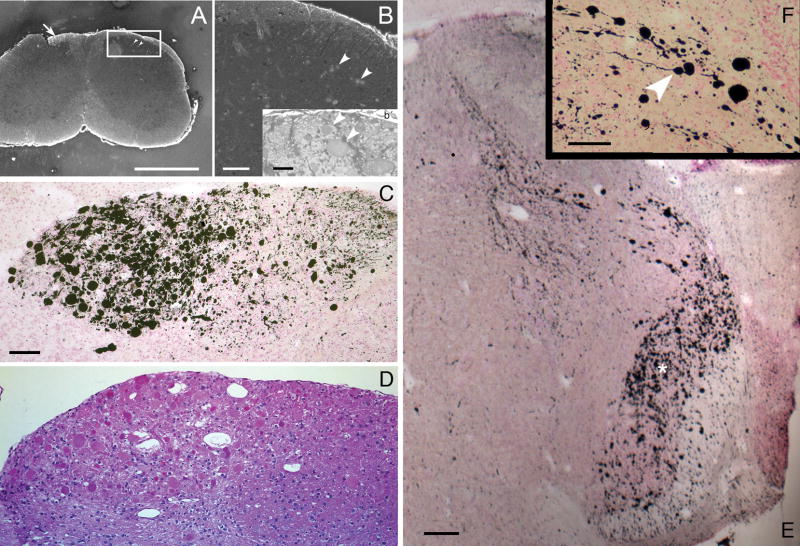
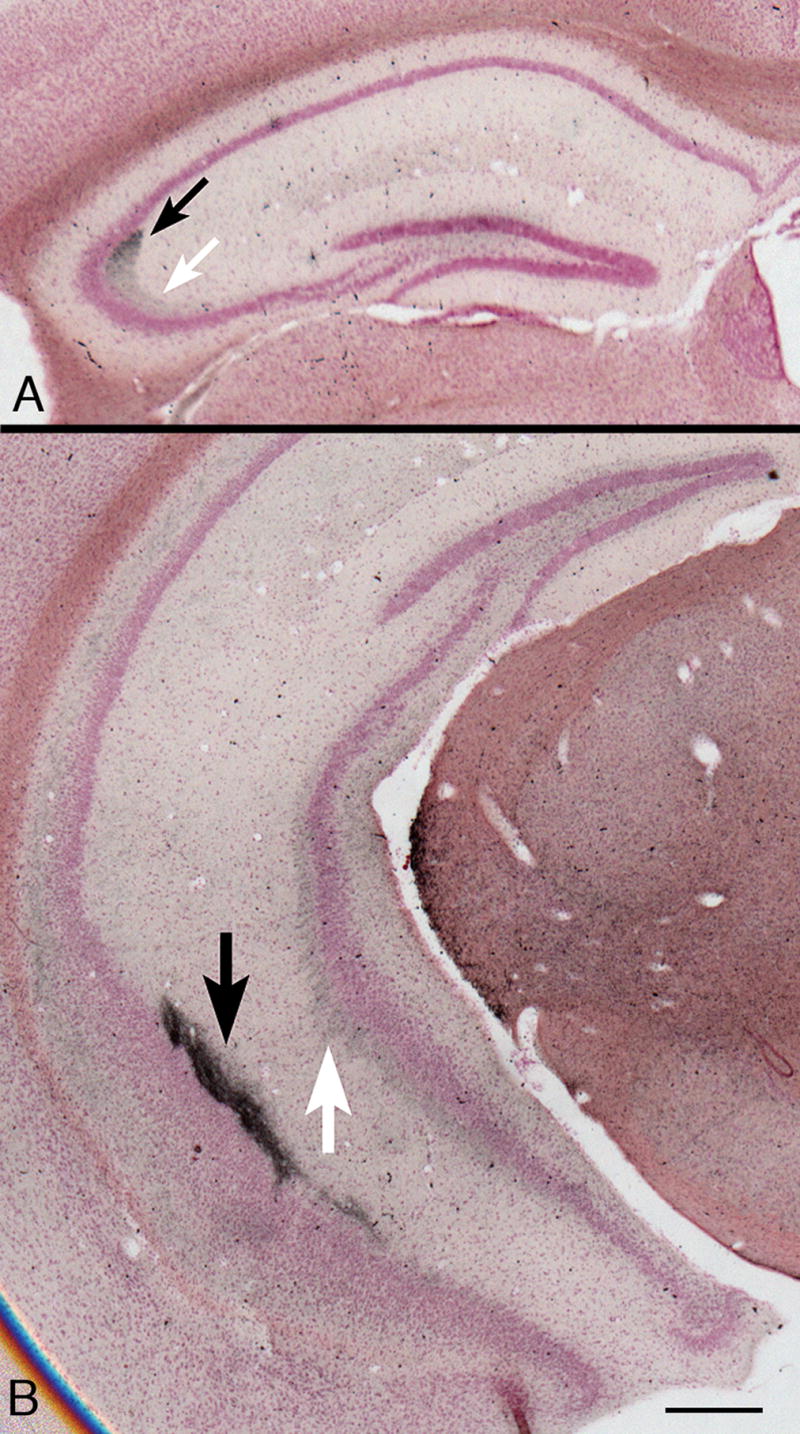
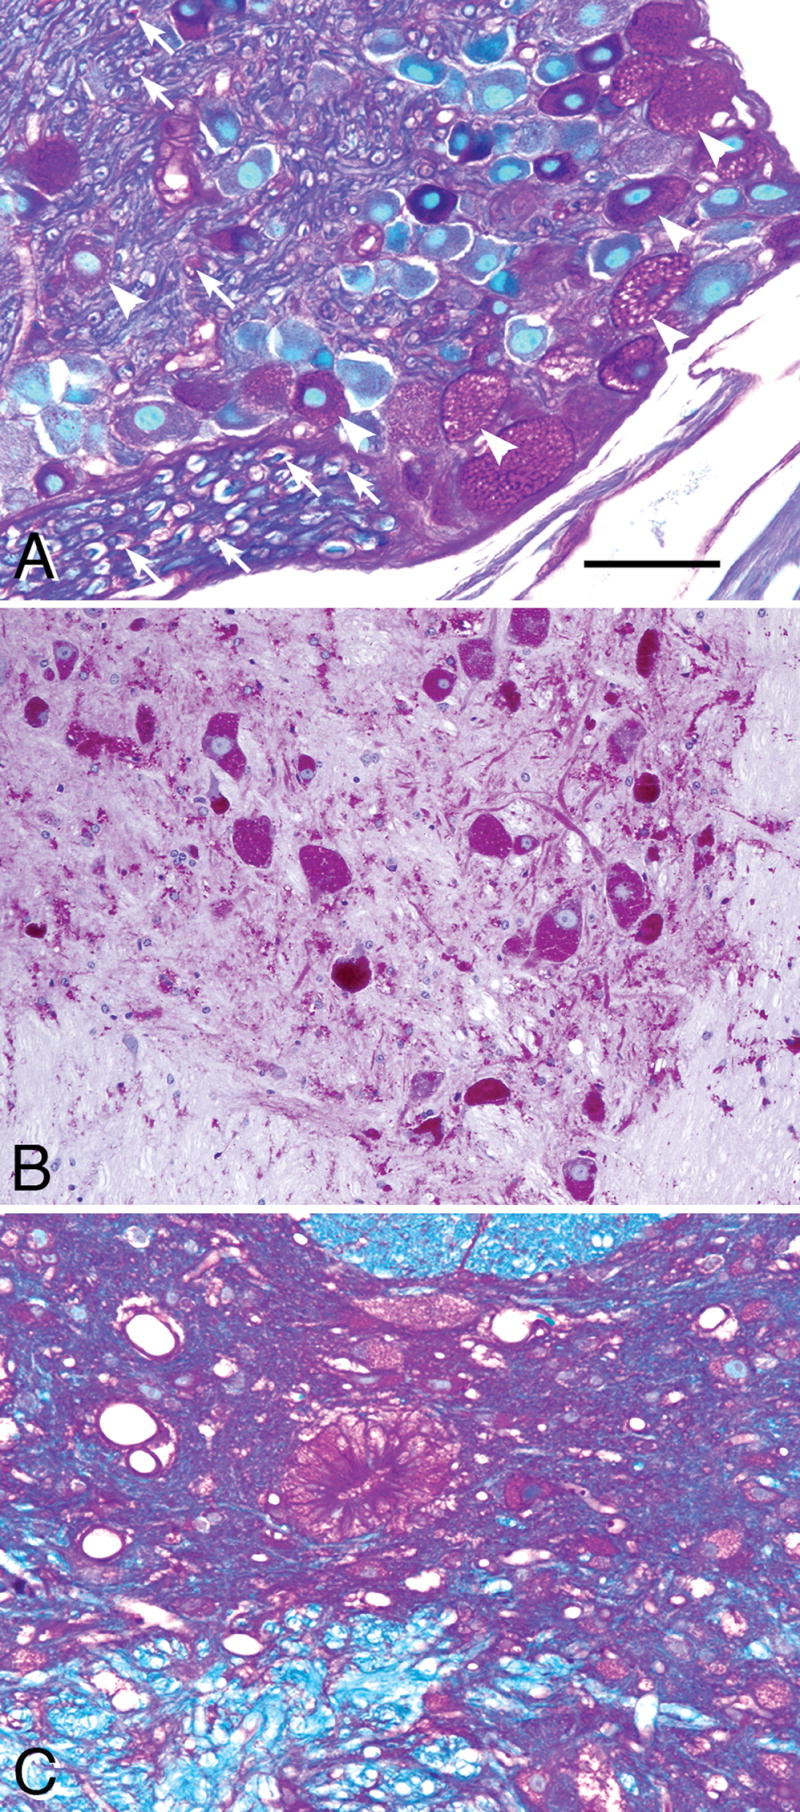
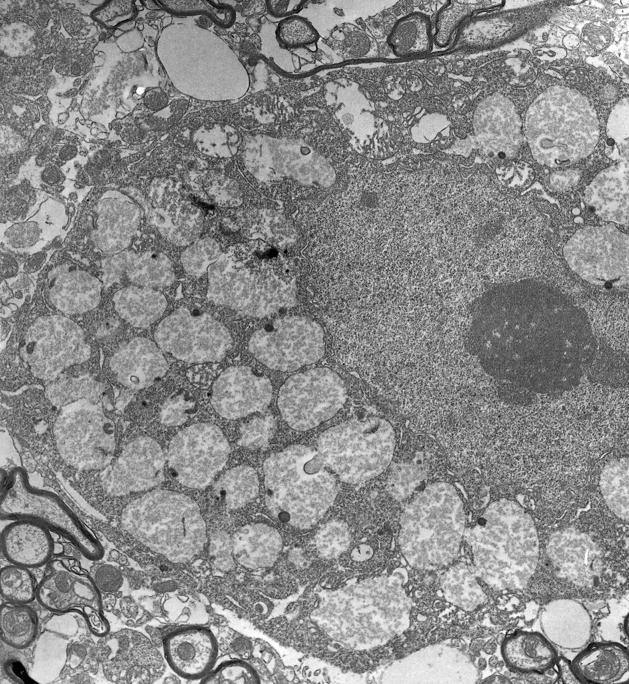
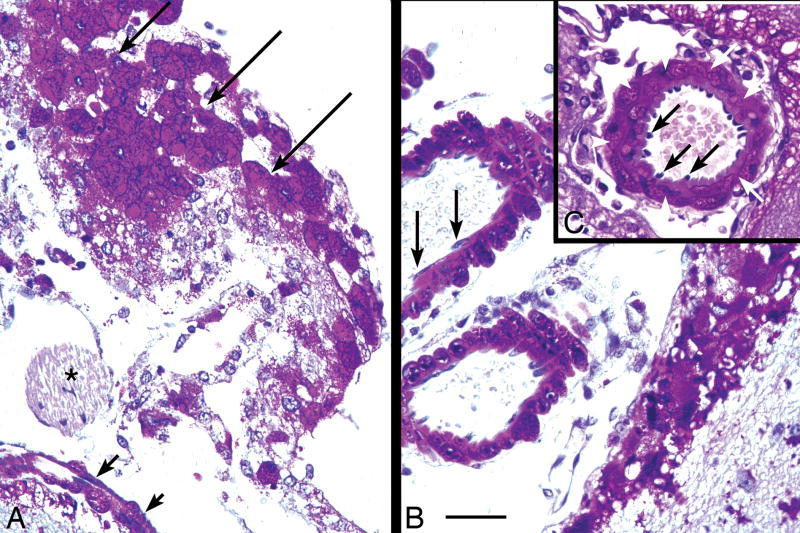
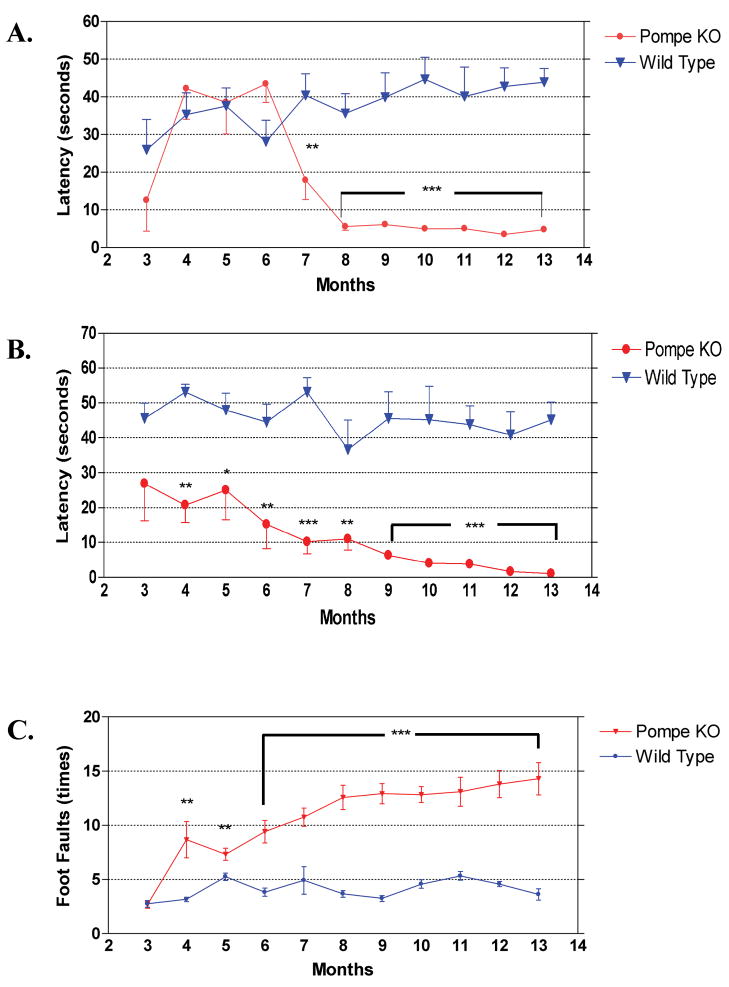
Pompe disease (glycogen storage disease II) is caused by mutations in the acid alpha-glucosidase gene. The most common form is rapidly progressive with glycogen storage, particularly in muscle, which leads to profound weakness, cardiac failure, and death by the age of 2 years. Although usually considered a muscle disease, glycogen storage also occurs in the CNS. We evaluated the progression of neuropathologic and behavioral abnormalities in a Pompe disease mouse model (6neo/6neo) that displays many features of the human disease. Homozygous mutant mice store excess glycogen within large neurons of hindbrain, spinal cord, and sensory ganglia by the age of 1 month; accumulations then spread progressively within many CNS cell types. "Silver degeneration" and Fluoro-Jade C stains revealed severe degeneration in axon terminals of primary sensory neurons at 3 to 9 months. These abnormalities were accompanied by progressive behavioral impairment on rotorod, wire hanging, and foot fault tests. The extensive neuropathologic alterations in this model suggest that therapy of skeletal and cardiac muscle disorders by systemic enzyme replacement therapy may not be sufficient to reverse functional deficits due to CNS glycogen storage, particularly early-onset, rapidly progressive disease. A better understanding of the basis for clinical manifestations is needed to correlate CNS pathology with Pompe disease manifestations.


Figures

Figure 1
Figure 1
(A) Temporal accumulation of glycogen in the CNS. Glycogen content of the total brain and spinal cord of five affected (1, 4, 6, 8 and 12 months old) and five normal (9 months old) animals, at each time point, is expressed as mg/g wet weight of tissue. Data are mean ± SEM. *, p < 0.05; **, p < 0.001, n = 5 per time point. (B) Glycogen content of the total brain and spinal cord of five affected (15 and 18 months old) and five normal (9 months old) animals, at each time point, is expressed as mg/g wet weight of tissue. Data are mean ± SEM. *, p < 0.05; **, p < 0.001, n = 5 per time point.
Figure 1
Figure 1
(A) Temporal accumulation of glycogen in the CNS. Glycogen content of the total brain and spinal cord of five affected (1, 4, 6, 8 and 12 months old) and five normal (9 months old) animals, at each time point, is expressed as mg/g wet weight of tissue. Data are mean ± SEM. *, p < 0.05; **, p < 0.001, n = 5 per time point. (B) Glycogen content of the total brain and spinal cord of five affected (15 and 18 months old) and five normal (9 months old) animals, at each time point, is expressed as mg/g wet weight of tissue. Data are mean ± SEM. *, p < 0.05; **, p < 0.001, n = 5 per time point.
Figure 2
Figure 2
Glycogen accumulation in each CNS region is progressive. Sagittal sections of paraffin-embedded tissue, sectioned at 7 μm and stained with PAS-hematoxylin show a portion of the lateral ventricle containing choroid plexus (upper left of each field) with the adult stem cell generation site bordering the upper right (rostral) side of the ventricle. Most of each field is occupied by the striatum (caudate/putamen). Cerebral neocortex is in the upper right. Between the striatum and neocortex is the beginning of the rostral migratory stream (arrows), which stands out because many of its cells are rich in glycogen. Upper left, wild-type (wt) 9 month control; upper middle, upper right, lower left, lower middle, and lower right show the corresponding field in mutant mice at 1, 3, 6, 9, and 15 months, respectively. Glycogen is just detectable in the knockout at 1 month and then increases progressively, predominantly in glial cells (3 months and older) and small blood vessels (6 and 9 months), throughout the striatum and neocortex. The corpus callosum, just dorsal to the striatum and rostral migratory stream, contains many glycogen-rich glial cells, progressively increasing from 3 months onward. Striatal neurons appear free of glycogen but had moderate increases in glycogen-containing lysosomes in PAS-stained 1 μm and 3 μm plastic sections (not shown). Magnification: 100x for all panels in this figure; bar: 400 μm.
Figure 3
Figure 3
Glycol methacrylate-embedded specimen, sectioned at 2 μm, stained with the PAS method and the Richardson counterstain, showing cells in the facial nucleus in the ventral pons. (A) Wild-type 3-month-old control mouse. (B–D) Panels are from 4-, 15-, and 22-month-old knockout mice, respectively. The enlarged round lysosomes are stained for glycogen with PAS (red), and fill the neuronal cell bodies. Most of the nuclei are displaced to the periphery of the cell, as in chromatolytic neurons. Similar data were obtained in large neurons in other brainstem motor nuclei. Magnification: 400x for all panels in this figure; bar: 20 μm.
Figure 4
Figure 4
Olfactory bulb glomerular layer, paraffin, 7-μm section, PAS-hematoxylin stain. (A) Wild-type 6-month control. (B–D) Knockouts at 1, 3, and 15 months, respectively. Glycogen increases progressively in periglomerular granule cell neurons and in glial cells within the glomeruli. Magnification: 200x for all panels in this figure; bar: 100 μm.
Figure 5
Figure 5
(A, B) Glycol methacrylate-embedded 3-μm sections of 4% paraformaldehyde-fixed, post-osmicated tissue stained with the periodic acid-Schiff method for glycogen, counterstained with Richardson’s stain, through the adult stem cell niche (A), and rostral migratory stream (B) in a 3-month-old knockout mouse. (A) The rostral part of the lateral ventricle is seen at the upper left, and is lined by ependymal cells containing little glycogen, but with prominent cytoplasmic lipid droplets of various sizes (black droplets, some marked with white arrows). External to the ependymal zone is a prominent subventricular zone in which the majority of large astrocytic stem (progenitor) cells are filled with glycogen (white arrowheads). The horizontal zone in the lower quarter of the field is the dorsal part of the striatum (caudate/putamen) with bundles of myelinated axons and interspersed glial cells, some of which contain moderate amounts of glycogen (black arrows). (B) Approximately halfway toward the olfactory bulb, illustrated here (and elsewhere along the RMS), the RMS is demarcated by prominent assemblage of glycogen-rich cells (black arrowheads), probably of both glial and young neuronal types. Smaller amounts of glycogen are present in glial cells of the striatum (black arrows in lower half of the field) and in the cerebral cortex (upper right quadrant). Panels A and B, magnification: 400x; bar: 100 μm. (C) Paraffin section, 7 μm, PAS-hematoxylin stain of the olfactory bulb. Positioned in a vertical band along the left side of the figure are the olfactory bulb’s glycogen-poor mitral neurons, which send axons out of the bulb in the lateral olfactory tract, to innervate regions in the basal and medial cerebral cortex. Many glycogen-rich cells lie in the outer granular layer (left two-thirds of the field, to the right of the mitral cell layer) and in the glomerular layer (right edge of the figure), especially in the periglomerular zones. Panel C, magnification: 200x; bar: 50 μm.
Figure 6
Figure 6
Paraffin section, 7 μm, PAS-hematoxylin. The hippocampal formation (dentate gyrus, hippocampus CA1, Ca2, and CA3, and subiculum) occupies the center of the field, and a sector of cerebral neocortex lies in the left part of the field of a 15-month-old knockout mouse. Glial cells contain increased glycogen in the radiatum and lacunosum layers of the hippocampus, in the dentate gyrus and subiculum, in the corpus callosum dorsal to the hippocampus, while glycogen-rich glial and vascular cells lie in the gray matter of the cerebral cortex (top left) and thalamus (left of inset). The inset shows lysosomal fluorescence (white), due to binding of the filipin reagent to lysosomal cholesterol in the apical cytoplasm of CA1 pyramidal neurons, even though these cells, delimited by the black bars in the colored part of the figure, are predominantly glycogen-free. Bar: 500 μm.
Figure 7
Figure 7
Cerebellar cortex, 15-month-old knockout mice. (A) Glycol methacrylate-embedded tissue sectioned at 3 μm, stained with Richardson’s stain. Purkinje neuron cell bodies (white arrows) are mildly vacuolated (and almost free of glycogen, as seen in B), whereas the cell bodies of adjacent Golgi epithelial cells (radially-oriented astrocytes) are markedly vacuolated. Magnification: 200x; bar: 20 μm. a′. Cryostat section, 20-μm-thick stained with the fluorescent dye, filipin, shows intense accumulation of cholesterol in the apical cytoplasm of Purkinje neurons (white arrows), even though these cells differ from most other large neurons in not accumulating comparable amounts of glycogen (B). Magnification: 100x. (B) Paraffin section, 7 μm, stained with the PAS method and counterstained with hematoxylin. There is marked glycogen accumulation in the cell bodies of Golgi epithelial cell astrocytes (horizontal black arrows) and in clumps in the granular layer and in the cytoplasm of most glial cells in the cerebellar cortical white matter (oblique black arrows). In contrast to many other types of large neurons, the Purkinje cell bodies contain only small amounts of glycogen (white arrows). Magnification: 200x, same magnification as in panel A. b′. Glycogen accumulation is prominent also in the molecular layer and in the cell bodies (horizontal black arrows) and apical cytoplasmic processes (Bergman fibers, oblique black arrows) of Golgi epithelial cell astrocytes, but not in basket or stellate neurons. Magnification: 200x; bar = 20 μm.
Figure 8
Figure 8
(A, B, and b′) From a transverse section through the cervical spinal cord of a 6-month-old knockout mouse stained with the fluorescent dye, Fluoro-Jade C, showing swollen axons that cross the dorsal gray matter (A, arrowheads in the boxed area, enlarged in B). These neurons will make synaptic contact with second-order neurons in the dorsal horn of the spinal cord. Some stained axons of dorsal root ganglion neurons ascend on the dorsal white matter (white arrow in A); they will terminate in grossly swollen axon terminals in the lower medulla (C, D). (C) Intense silver precipitation (black staining) in the nucleus gracilis (left half of field) and less in the adjacent nucleus cuneatus (right half of field). This image is from a slide stained by the cupric silver method of De Olmos (–32). Comparable staining in these second order sensory nuclei was observed bilaterally in every section through the low medulla stained by this method from every knockout mouse at all ages from 1 to 15 months but not in comparable sections from wild-type mice or from mice with other lysosomal storage diseases mounted on the same slides. (D) The corresponding field from a nearby section stained with hematoxylin and eosin, showing that the swollen axon terminals stained with silver in C are also stained homogeneously with eosin (red). (E) Transverse section through the rostral medulla of an 11-month-old knockout mouse, showing silver-stained (black) swollen and degenerating axon terminals in the lateral and dorsal medulla, the former (broad band oriented vertically, marked with white asterisk) clearly belonging to the spinal tract of the trigeminal nerve and the latter (a lesser band oriented from dorsomedially to ventrolaterally) from the same tract or possibly from the solitarius sensory pathway. (F) This inset, at higher magnification, shows short segments of axons of normal or near-normal caliber terminating in grossly swollen endings of 5- to 50-μm diameter (e.g. white arrowhead). Magnifications: C, D, 200x; E, 20x; F, 400x. Bars: A, 600 μm; B, 100 μm; b′, 50 μm; C, D, 200 μm; E, 400 μm; F, 100 μm.
Figure 9
Figure 9
(A) Rostral part of the hippocampal formation in a coronal section from a 7-month-old knockout mouse. Staining intensity is strongest on the CA2 side of the fuzzy boundary between segments CA2 (black arrow) and CA3 (white arrow). The pyramidal cell body layer at the medial end of CA3, close to the hilus of the dentate gyrus shows a typical mild malformation. There is minimal silver degeneration staining in the hilus and dorsal limb of the dentate gyrus. De Olmos silver degeneration stain. (B) At a more caudal level in a comparable 9-month-old knockout mouse, the hippocampal formation curves ventrally (for orientation, see three-dimensional reconstructions in http://www.hms.harvard.edu/research/brain), so that CA2 (black arrow) and CA3 (white arrow) here are separate from each other. Differences in staining intensity between CA2 and CA3 are clear. Magnifications: A, B, 20x. Bars: A, B, 500 μm.
Figure 10
Figure 10
(A) Paraffin-embedded 7-μm section stained with the PAS method and counterstained with Richardson’s stain shows that many, but not all, dorsal root ganglion (DRG) neuron cell bodies are filled with glycogen and contain vacuoles at sites where lipids have dissolved out during the processing of the tissue (white arrowheads). Relatively low amounts of glycogen are also seen in Schwann cells (white arrows) and endothelial cells of the peripheral nerve. (B) Glycol methacrylate-embedded 3-μm section through the low thoracic spinal cord, PAS stain for glycogen, Richardson counterstain. Large ventral horn motor neurons were filled with glycogen-containing lysosomes and small neurons and many glial cells in gray and white matter also accumulated glycogen. (C) The columnar ependymal cells of the spinal cord stained strongly for glycogen in a 3-month-old mutant mouse. Ependymal cells in the brains of these mice contained little or no glycogen. Magnification: all panels, 200x. Bar: all panels, 30 μm.
Figure 11
Figure 11
Electron micrograph of part of the cell body of a spinal cord motor neuron. The cell nucleus occupies the middle right part of the field, and is surrounded by cytoplasm in which more than 50% of the volume is occupied by enlarged lysosomes. Magnification: 12,500x.
Figure 12
Figure 12
(A–C) Paraffin-embedded 7-μm section stained with the PAS method and counterstained with hematoxylin, showing meningeal cells and large blood vessels at the dorsal surface of the midbrain of a 15-month-old knockout mouse. (A) Large flat meningeal cells in face view (long arrows) and edge view (short arrows), are filled with glycogen. By contrast, the myelinated IVth cranial nerve (asterisk) lying external to the brainstem in the meninges, appears to be glycogen-free. (B) Large meningeal blood vessels. The large arteries and thin-walled veins external to the brain have glycogen-free endothelial cells (black arrows). (C) The endothelial cells (black arrows) in arteries are surrounded by glycogen-rich smooth muscle cells (white arrows). Magnification: 400x. Bar: all panels, 50 μm.
Figure 13
Figure 13
(A) Rocking rotarod test for muscle strength and muscle coordination. All animal were tested from 3 to 12 months of age, with 12 animals per group. Pompe knockout mouse performance deteriorated sharply between 6 and 8 months of age, and remained poor thereafter. Data are mean ± SEM. **, p < 0.01; ***, p < 0.001 (Student t test). (B) Wire hang test for muscle strength. All animals, 12 per group, were tested from 3 to 13 months of age. Knockout mice gave significantly poorer scores at all ages. Data are mean ± SEM. **, p < 0.01; ***, p < 0.001 (Student t test). (C) Foot fault test for muscle coordination. All animals, 12 per group, were tested from 3 to 13 months of age. Knockout mice were indistinguishable from controls at 3 months of age, but showed significantly more foot faults at all older ages. Data are mean ± SEM. **, p < 0.01; ***, p < 0.001 (Student t test).

References

    1. Pompe JC. Over idiopathische hypertrophie van het hart. Ned Tijdschr Geneeskd. 1932;76:304–11.
    1. Hirshhorn R, Reuser A. Glycogen Storage Disease Type II: Acid alpha-glucosidase (acid maltase) deficiency. In: Schriver CR, Beaudet AL, Sly WS, Valle D, editors. Metabolic and Molecular Bases of Inherited Disease. New York, NY: McGraw-Hill; 2001. pp. 3389–420.
    1. Cori GT. Glycogen structure and enzyme deficiencies in glycogen storage disease. Harvey Lect. 1954;8:145–71. - PubMed
    1. Hers HG. Alpha-glucosidase deficiency in generalized glycogen storage disease (Pompe’s disease) Biochem J. 1963;86:11–16. - PMC - PubMed
    1. Reuser AJ, Drost MR. Lysosomal dysfunction, cellular pathology and clinical symptoms: Basic principles. Acta Paediatr Suppl. 2006;95:77–82. - PubMed

MeSH terms