. 2008 Jul 23;3(7):e2718.
doi: 10.1371/journal.pone.0002718.

Mitochondrial Ca2+ overload underlies Abeta oligomers neurotoxicity providing an unexpected mechanism of neuroprotection by NSAIDs

Affiliations

Mitochondrial Ca2+ overload underlies Abeta oligomers neurotoxicity providing an unexpected mechanism of neuroprotection by NSAIDs

Sara Sanz-Blasco et al. PLoS One. .

Abstract

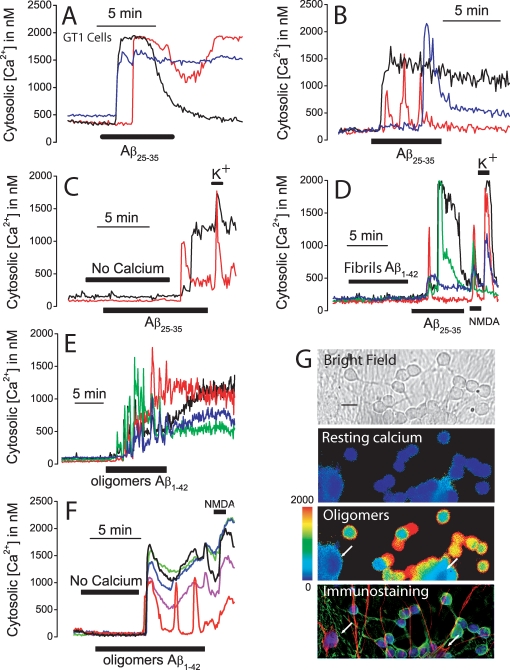
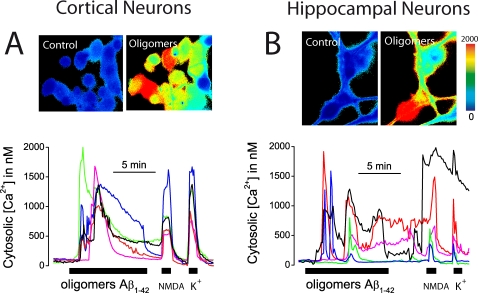
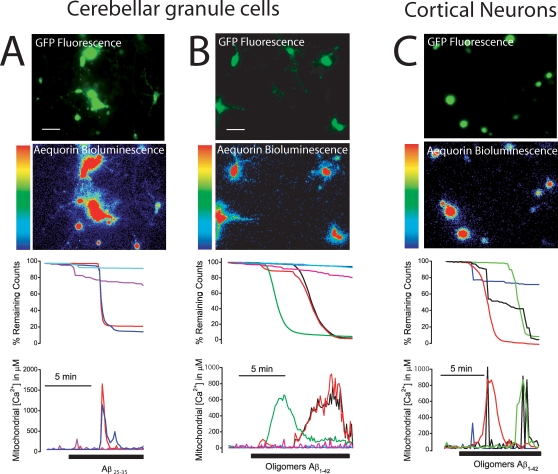
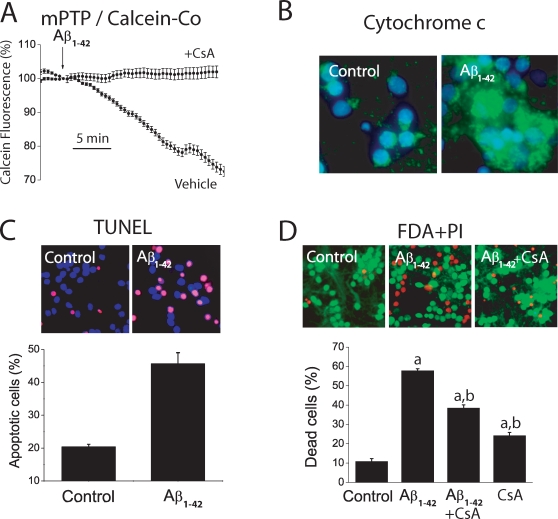
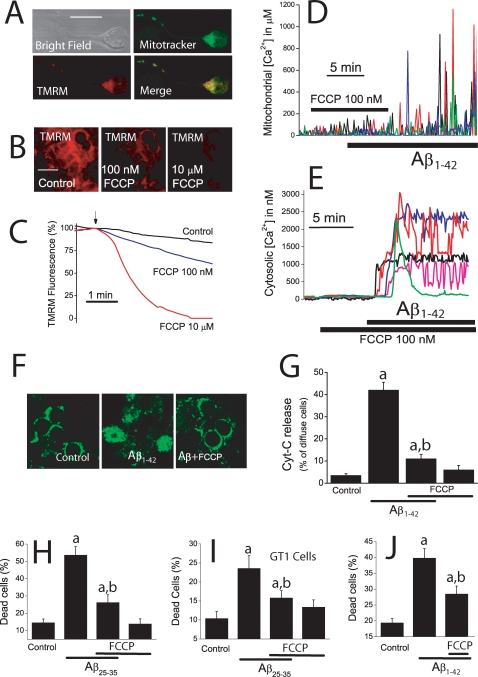
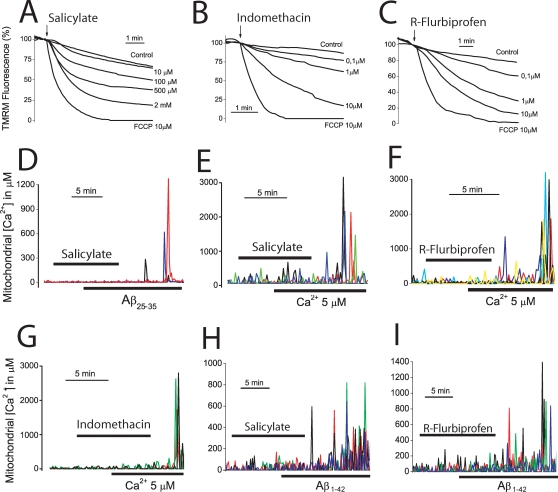
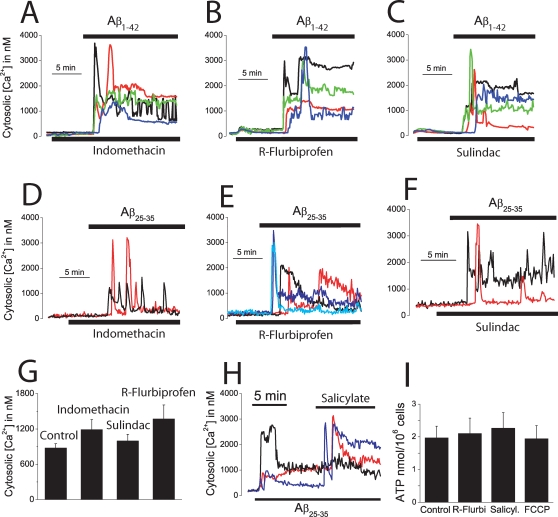
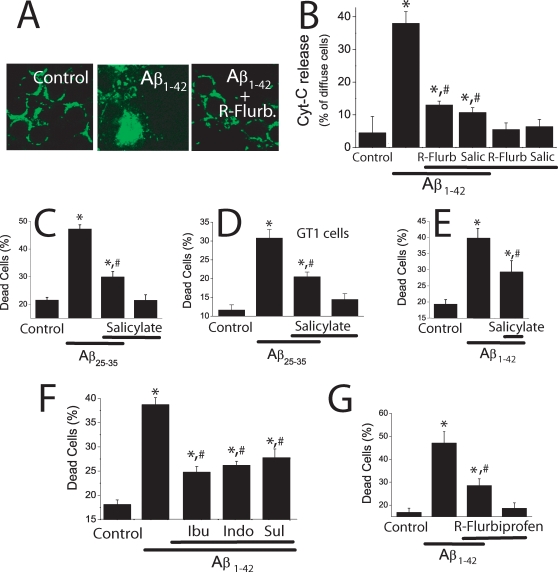
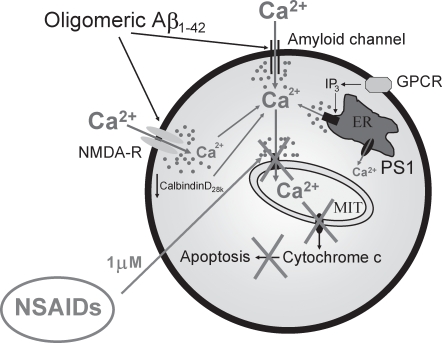
Dysregulation of intracellular Ca(2+) homeostasis may underlie amyloid beta peptide (Abeta) toxicity in Alzheimer's Disease (AD) but the mechanism is unknown. In search for this mechanism we found that Abeta(1-42) oligomers, the assembly state correlating best with cognitive decline in AD, but not Abeta fibrils, induce a massive entry of Ca(2+) in neurons and promote mitochondrial Ca(2+) overload as shown by bioluminescence imaging of targeted aequorin in individual neurons. Abeta oligomers induce also mitochondrial permeability transition, cytochrome c release, apoptosis and cell death. Mitochondrial depolarization prevents mitochondrial Ca(2+) overload, cytochrome c release and cell death. In addition, we found that a series of non-steroidal anti-inflammatory drugs (NSAIDs) including salicylate, sulindac sulfide, indomethacin, ibuprofen and R-flurbiprofen depolarize mitochondria and inhibit mitochondrial Ca(2+) overload, cytochrome c release and cell death induced by Abeta oligomers. Our results indicate that i) mitochondrial Ca(2+) overload underlies the neurotoxicity induced by Abeta oligomers and ii) inhibition of mitochondrial Ca(2+) overload provides a novel mechanism of neuroprotection by NSAIDs against Abeta oligomers and AD.


Conflict of interest statement

Competing Interests: The authors have declared that no competing interests exist.

Figures

Figure 1
Figure 1. Aβ1–42 oligomers but not fibrils induce Ca2+ influx in neurons.
A–B. GT1 neural cells and cerebellar granule cells were loaded with fura2/AM and subjected to calcium imaging. Traces show the effects of Aβ25–35 (20 µM) on [Ca2+]cyt in three representative GT1 neural cells (A) and cerebellar granule cells (B). Data representative of 141–233 cells studied in 4 and 3 independent experiments, respectively. C. The increase in [Ca2+]cyt induced by Aβ25–35 (20 µM) in cerebellar granule cells is abolished in medium lacking extracellular Ca2+ (No calcium). Addition of normal medium containing 1 mM Ca2+ restored the response to Aβ25–35. High K+ medium (150 mM K+) induced a further increase in [Ca2+]cyt. Traces correspond to two individual cells representative of n = 98 cells, 2 experiments). D. Aβ1–42 fibrils (2 µM) induced little or no [Ca2+]cyt increase in cerebellar granule cells. The same cells responded Aβ25–35 (20 µM), N-methyl D-aspartate (100 µM NMDA) and high K+ medium (150 mM K+). (Traces correspond to four individual cells representative of n = 90 cells 3 experiments). E. Aβ1–42 oligomers (500 nM) induced a large and sustained increase in [Ca2+]cyt in cerebellar granules cells. Traces correspond to four individual cells representative of n = 404 cells 5 experiments). F. The effects of Aβ1–42 oligomers (500 nM) are inhibited in medium lacking extracellular Ca2+ (No calcium). Perfusion of medium containing Ca2+ restored the response to Aβ oligomers. Cells also responded to 100 µM NMDA (recordings correspond to 5 individual cells representative of n = 283 cells, 3 experiments). G. Cerebellar granule cells were subjected to calcium imaging and then identified by double immunocytochemistry. Pictures show a bright field image (scale bar represents 10 µm) and [Ca2+]cyt levels before (resting calcium) and after treatment with Aβ1–42 oligomers (oligomers) coded in pseudocolor (pseudocolor bar from 0 to 2000 nM shown at left) and immunostaining of the cells. Glial cells (arrows) are coded in red, neurons are coded in green and nuclei are coded in blue. Only neurons responded to Aβ oligomers with a rise in [Ca2+]cyt. Data representative of 249 cells, 3 experiments.
Figure 2
Figure 2. Aβ1–42 oligomers induce [Ca2+]cyt increases in cortical and hippocampal neurons.
Pictures show pseudocolor images of [Ca2+]cyt before (control) and after (oligomers) perfusion with 500 nM Aβ1–42 oligomers in cortical (A) and hippocampal (B) neurons loaded with fura4F. Pseudocolor scale shown at right. Traces are recordings of [Ca2+]cyt in 5 representative cortical (A) and hippocampal (B) neurons during stimulation with Aβ1–42 oligomers. Cells responding to Aβ1–42 oligomers also responded to 100 µM NMDA and 150 mM K+. Data are representative of n = 218 cortical cells and n = 149 hippocampal cells studied in at least 3 independent experiments for each brain area.
Figure 3
Figure 3. Aβ1–42 oligomers induce mitochondrial Ca2+ overload.
Cerebellar granule cells and cortical neurons were transfected with the low-affinity, mitochondria-targeted aequorin fused to GFP, incubated with 1 µM n coelenterazine and subjected to bioluminescence imaging of [Ca2+]mit. Pictures show the fluorescence (top, GFP fluorescence) and accumulated photonic emissions (bottom, Aequorin Bioluminescence) images of representative microscopic fields (scale bar represents 10 µm). Luminescence intensity is coded in pseudocolor (1 to 32 photons per pixel). Traces show the effects of Aβ25–35 (20 µM, A) and Aβ1–42 oligomers (500 nM, B) on % of remaining counts (top traces) and calibrated [Ca2+]mit (bottom traces) in individual, representative cerebellar granule cells (A,B) and cortical neurons (C). Data are representative of 37, 36 and 68 individual cells studied in 3 independent experiments, respectively.
Figure 4
Figure 4. Aβ1–42 oligomers induce mPTP opening, cytochrome c release, apoptosis and cell death.
A. Mitochondrial permeability transition was assessed directly by the calcein/Co2+ method. Cerebellar granule cells were loaded with calcein/AM 1 µM and CoCl2 1 mM for 15 min at 37°C and calcein fluorescence quenching was imaged. Traces correspond to mean±SEM fluorescence records normalized to the value before the addition of oligomeric Aβ1–42 (500 nM) in responsive cells (n = 16 cells, vehicle) or in cyclosporin (1 µM) treated cells. Representative of 3 experiments. B. Location of cytochrome c was assessed by immunofluorescence against cytochrome c. Cerebellar granule cells were cultured for 72 h in vehicle or 500 nM Aβ1–42 oligomers. Blue colors show nuclei stained with DAPI. Green colors show location of cytochrome c. Control cells show punctate distribution of cytochrome c. Aβ oligomers-treated cells show a more diffuse location of cytochrome c due to release of cytochrome c from mitochondria. Representative of 3 independent experiments. Scale bar represents 10 µm. C. Cerebellar granule cells were cultured for 72 h in vehicle or Aβ1–42 oligomers (500 nM) and apoptosis was tested by TUNEL assay. Pictures show nuclei (blue) and apoptotic cells (purple). Bars show % of apoptotic cells. (n = 3; *p<0 05). Scale bar represents 10 µm. D. Cerebellar granule cells were cultured for 72 h with vehicle (control) or Aβ1–42 oligomers (500 nM) and cell death was assessed by staining with FDA (green living cells) and PI (red dead cells, scale bar represents 10 µm. Shown are also the effects cyclosporin A (1 µM) on Aβ1–42 oligomers-induced death in cerebellar granule cells (n = 3; ap<0 05 vs control; bp<0 05 vs Aβ1–42). Representative of 3 independent experiments.
Figure 5
Figure 5. Mitochondrial Ca2+ uptake contributes to cell death induced by Aβ oligomers.
A. Cerebellar granule cells were co-loaded with mitotracker green and TMRM 10 nM and washed. Double staining was assessed by confocal microscopy. Pictures show bright field mitotracker staining, TMRM staining and merge of mitotracker and TMRM staining. Images confirm the mitochondrial location of the TMRM probe. Scale bar represents 10 µm. B. Cells were loaded with TMRM 10 nM and mitochondrial depolarization was estimated by the decrease in TMRM fluorescence. Pictures show TMRM fluorescence images of cerebellar granule cells treated for 5 min with vehicle (control), 100 nM FCCP or 10 µM FCCP. Scale bar represents 10 µm. C. Traces show fluorescence recordings of cerebellar granule cells stained with 10 nM TMRM. Fluorescence values from individual cells were normalized to the value before addition (arrow) of either vehicle or FCCP and averaged. Each trace is the mean of 45–67 cells and representative of at least 3 independent experiments. D. Cerebellar granule cells expressing mGA were subjected to bioluminescence for [Ca2+]mit measurements. FCCP 100 nM inhibits the increase in [Ca2+]mit induced by Aβ1–42 oligomers (500 nM, 21 cells, 3 experiments). After washout of FCCP, Aβ1–42 oligomers were able to increase [Ca2+]mit. E. Cerebellar granule cells were loaded with fura2/AM and subjected to fluorescence imaging for [Ca2+]cyt measurements. FCCP 100 nM failed to inhibit the increase in [Ca2+]cyt induced by Aβ1–42 oligomers (500 nM) (n = 78 cells, 3 experiments). F. Immunofluorescence against cytochrome c was assessed by confocal microscopy in cerebellar granule cells treated with vehicle (Control), Aβ1–42 oligomers 500 nM (Aβ) and Aβ1–42 oligomers+FCCP 100 nM (Aβ+FCCP) for 72 h. Aβ1–42 oligomers promote diffusion of cytochrome c that otherwise shows a punctate staining. 100 nM FCCP prevented diffusion of cytochrome C. Scale bar represents 10 µm. G. Bars show % of cells showing diffuse staining for cytochrome c (reflecting cytochrome c release). Aβ1–42 oligomers (500 nM) increase the % of cells showing diffuse staining, an effect inhibited by FCCP 100 nM. H–J. FCCP 100 nM inhibits cell death induced by 20 µM Aβ25–35 in cerebellar cells (H) and GT1 cells (I) and by 500 nM Aβ1–42 oligomers in cerebellar granule cells (J) as assessed by dye exclusion studies. ap<0 05 vs. control; All data are mean±SEM of 3 independent experiments.
Figure 6
Figure 6. NSAIDs depolarize mitochondria and inhibit mitochondrial Ca2+ uptake.
A–C. Cerebellar granule cells were stained with 10 nM TMRE and subjected to fluorescence microscopy for monitoring changes in mitochondrial potential. Each trace correspond to averaged, normalized fluorescence values of 34–42 cells treated (arrow) with vehicle (control) or different concentrations of salicylate (A, 10 µM to 2 mM), indomethacin (B, 0.1 to 10 µM), R-flurbiprofen (C, 0.1 to 10 µM). FCCP 10 µM was also added to compare with conditions of collapse of the mitochondrial potential. Each series of recordings is representative of at least 3 experiments. D–F. Cerebellar granule cells were transfected with the mGA plasmid and subjected to bioluminescence imaging for monitoring [Ca2+]mit. Salicylate (D, 100 µM) inhibits the [Ca2+]mit induced by Aβ25–35 (20 µM, n = 43 cells, 3 experiments). In some experiments, cerebellar granule cells expressing mGA were permeabilized in intracellular medium containing 200 nM Ca2+ (see methods) and treated with salicylate 100 µM (E), R-flurbiprofen 1 µM (F) or indomethacin 1 µM (G) before being stimulated with the same intracellular medium containing 5 µM Ca2+ to stimulate mitochondrial Ca2+ uptake (Data from 188 cells studied in 6 independent experiments). H,I. Salicylate 100 µM and R-flurbiprofen 1 µM also inhibits the increase in [Ca2+]mit induced by Aβ1–42 oligomers (500 nM). Data from n = 35 and 30 cells respectively, studied in 3 independent experiments for each drug.
Figure 7
Figure 7. NSAIDs do not prevent the increase in [Ca2+]cyt induced by Aβ1–42- oligomers or affect cell ATP levels.
A–C, cerebellar granule cells were loaded with fura4F/AM and subjected to calcium imaging to test the effects of several NSAIDs on the increases in [Ca2+]cyt induced by Aβ1–42 oligomers. Neither indomethacin (A), R-flurbiprofen (B) or sulindac sulfide (C), all tested at 1 µM, inhibit the increase in [Ca2+]cyt induced by Aβ1–42 oligomers. Data corresponds to 76–120 cells, corresponding to at least 2 experiments. D–G, indomethacin, R-flurbiprofen or sulindac sulfide (all tested at 1 µM) neither inhibit the increase in [Ca2+]cyt induced by Aβ25–35. Shown are representative recordings of individual cells (46–90 cells studied in 3 independent experiments respectively). G. The maximum increase in [Ca2+]cyt induced by Aβ25–35 (20 µM) was calculated for cells treated with vehicle (control) or the above NSAIDs (p>0,05; n = 3). H. Salicylate 100 µM increased [Ca2+]cyt further in cells treated with Aβ25–35 (20 µM). Representative recordings of 164 cells studied in 3 independent experiments. I. Cerebellar granule cells were treated with vehicle, 1 µM R-flurbiprofen, 100 µM salicylate and 100 nM FCCP for 72 h and cell ATP levels were measured. None of the treatments decreases significantly cell ATP levels (p>0,05; n = 3).
Figure 8
Figure 8. NSAIDs inhibit cytochrome c release and cell death induced by Aβ1–42 oligomers.
A,B. Cerebellar granule cells were treated with Aβ1–42 (500 nM) for 72 h with or without 1 µM R-flurbiprofen or 100 µM salicylate and fixed for analysis of cytochrome c location using confocal microscopy. A. Control cells showed a punctate distribution of cytochrome c. Scale bar represents 10 µm. Aβ1–42 oligomers-treated cells show a more diffuse pattern of cytochrome c whereas cells treated with Aβ1–42 oligomers plus R-flurbiprofen show a punctate pattern similar to control cells. B. Bars show the relative abundance (%) of cells showing diffuse immunostaining in control cells, cells treated with Aβ1–42 oligomers and cells treated with Aβ1–42 oligomers plus 1 µM R-flurbiprofen or 100 µM salicylate (B). *p<0 05 vs control; #p<0 05 vs Aβ; data from at least 3 independent experiments. Salicylate 100 µM inhibits cell death induced by Aβ25–35 (20 µM) in cerebellar granule cells (C) and GT1 cells (D). Salicylate 100 µM also inhibits cell death induced by Aβ1–42 oligomers (500 nM) in cerebellar granule cells (E). (*p<0 05 vs control; #p<0 05 vs Aβ. n = 3). F. Ibuprofen (Ibu), Indomethacin (Indo), and sulindac sulfide (Sul), all tested at 1 µM, inhibit cell death induced by Aβ1–42 oligomers (500 nM) in cerebellar granule cells. G. R-Flurbiprofen 1 µM also inhibits cell death induced by Aβ1–42 oligomers (500 nM). *p<0 05 vs. control; #p<0 05 vs Aβ. All data are representative of 3 experiments.
Figure 9
Figure 9. A model of Aβ-induced toxicity and neuroprotection by NSAIDs based on mitochondrial Ca2+.
1–42 oligomers and the toxic fragment Aβ25–35 induce a large entry of Ca2+ through the plasma membrane likely mediated by formation of amyloid channels and/or NMDA receptors. This entry promotes in a sequential manner mitochondrial Ca2+ overload, ROS production, mPTP opening, cytochrome c release, apoptosis and cell death. Other factors related to AD may favor mitochondrial Ca2+ overload including exaggerated IP3-induced release of Ca2+ from the ER in loss of function PS1 mutants related to familial AD and/or decreased abundance of endogenous Ca2+ buffers as calbindinD28k during aging or sporadic AD. NSAIDs, at low concentrations (1 µM), depolarize partially mitochondria and inhibit mitochondrial Ca2+ overload, thus preventing cytochrome c release and apoptosis induced by Aβ oligomers.

References

    1. Wegiel J, Wisniewski HM, Dziewiatkowski J, Badmajew E, Tarnawski M, et al. Cerebellar atrophy in Alzheimer's disease-clinicopathological correlations. Brain Res. 1999;818:41–50. - PubMed
    1. Allen JW, Eldadah BA, Faden AI. Beta-amyloid-induced apoptosis of cerebellar granule cells and cortical neurons: exacerbation by selective inhibition of group I metabotropic glutamate receptors. Neuropharmacology. 1999;38:1243–1252. - PubMed
    1. Canu N, Calissano P. In vitro cultured neurons for molecular studies correlating apoptosis with events related to Alzheimer disease. Cerebellum. 2003;2:270–278. - PubMed
    1. Plant LD, Webster NJ, Boyle JP, Ramsden M, Freir DB, et al. Amyloid beta peptide as a physiological modulator of neuronal ‘A’-type K+ current. Neurobiol Aging. 2006;11:1673–1683. - PubMed
    1. McGeer PL, Rogers J, McGeer EG. Inflammation, anti-inflammatory agents and Alzheimer disease: the last 12 years. J Alzheimers Dis. 2006;9:271–276. - PubMed

Publication types