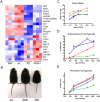
Altered metabolism of growth hormone receptor mutant mice: a combined NMR metabonomics and microarray study
- PMID: 18648510
- PMCID: PMC2447874
- DOI: 10.1371/journal.pone.0002764
Altered metabolism of growth hormone receptor mutant mice: a combined NMR metabonomics and microarray study
Abstract
Background: Growth hormone is an important regulator of post-natal growth and metabolism. We have investigated the metabolic consequences of altered growth hormone signalling in mutant mice that have truncations at position 569 and 391 of the intracellular domain of the growth hormone receptor, and thus exhibit either low (around 30% maximum) or no growth hormone-dependent STAT5 signalling respectively. These mutations result in altered liver metabolism, obesity and insulin resistance.
Methodology/principal findings: The analysis of metabolic changes was performed using microarray analysis of liver tissue and NMR metabonomics of urine and liver tissue. Data were analyzed using multivariate statistics and Gene Ontology tools. The metabolic profiles characteristic for each of the two mutant groups and wild-type mice were identified with NMR metabonomics. We found decreased urinary levels of taurine, citrate and 2-oxoglutarate, and increased levels of trimethylamine, creatine and creatinine when compared to wild-type mice. These results indicate significant changes in lipid and choline metabolism, and were coupled with increased fat deposition, leading to obesity. The microarray analysis identified changes in expression of metabolic enzymes correlating with alterations in metabolite concentration both in urine and liver. Similarity of mutant 569 to the wild-type was seen in young mice, but the pattern of metabolites shifted to that of the 391 mutant as the 569 mice became obese after six months age.
Conclusions/significance: The metabonomic observations were consistent with the parallel analysis of gene expression and pathway mapping using microarray data, identifying metabolites and gene transcripts involved in hepatic metabolism, especially for taurine, choline and creatinine metabolism. The systems biology approach applied in this study provides a coherent picture of metabolic changes resulting from impaired STAT5 signalling by the growth hormone receptor, and supports a potentially important role for taurine in enhancing beta-oxidation.
Conflict of interest statement
Figures


Similar articles
-
Study of acute biochemical effects of thallium toxicity in mouse urine by NMR spectroscopy.J Appl Toxicol. 2011 Oct;31(7):663-70. doi: 10.1002/jat.1617. Epub 2011 Jan 7. J Appl Toxicol. 2011. PMID: 21218500
-
In vivo analysis of growth hormone receptor signaling domains and their associated transcripts.Mol Cell Biol. 2005 Jan;25(1):66-77. doi: 10.1128/MCB.25.1.66-77.2005. Mol Cell Biol. 2005. PMID: 15601831 Free PMC article.
-
1HNMR-based metabonomic study of sub-chronic hepatotoxicity induced by realgar.J Ethnopharmacol. 2016 Nov 4;192:1-9. doi: 10.1016/j.jep.2016.07.003. Epub 2016 Jul 1. J Ethnopharmacol. 2016. PMID: 27377338
-
Probing gender-specific metabolism differences in humans by nuclear magnetic resonance-based metabonomics.Anal Biochem. 2006 May 15;352(2):274-81. doi: 10.1016/j.ab.2006.02.033. Epub 2006 Mar 20. Anal Biochem. 2006. PMID: 16600169
-
Unconventional microarray design reveals the response to obesity is largely tissue specific: analysis of common and divergent responses to diet-induced obesity in insulin-sensitive tissues.Appl Physiol Nutr Metab. 2012 Apr;37(2):257-68. doi: 10.1139/h11-159. Epub 2012 Mar 27. Appl Physiol Nutr Metab. 2012. PMID: 22452611
Cited by
-
Specific metabolic fingerprint of a dietary exposure to a very low dose of endosulfan.J Toxicol. 2013;2013:545802. doi: 10.1155/2013/545802. Epub 2013 Jan 29. J Toxicol. 2013. PMID: 23431292 Free PMC article.
-
Loss of growth hormone-mediated signal transducer and activator of transcription 5 (STAT5) signaling in mice results in insulin sensitivity with obesity.FASEB J. 2019 May;33(5):6412-6430. doi: 10.1096/fj.201802328R. Epub 2019 Feb 19. FASEB J. 2019. PMID: 30779881 Free PMC article.
-
A network-based approach to prioritize results from genome-wide association studies.PLoS One. 2011;6(9):e24220. doi: 10.1371/journal.pone.0024220. Epub 2011 Sep 6. PLoS One. 2011. PMID: 21915301 Free PMC article.
-
In Vivo Exposures to Particulate Matter Collected from Saudi Arabia or Nickel Chloride Display Similar Dysregulation of Metabolic Syndrome Genes.J Toxicol Environ Health A. 2015;78(23-24):1421-36. doi: 10.1080/15287394.2015.1095689. J Toxicol Environ Health A. 2015. PMID: 26692068 Free PMC article.
-
The urine metabolome differs between lean and overweight Labrador Retriever dogs during a feed-challenge.PLoS One. 2017 Jun 29;12(6):e0180086. doi: 10.1371/journal.pone.0180086. eCollection 2017. PLoS One. 2017. PMID: 28662207 Free PMC article.
References
-
- Harvey S, Scanes CG, Daughaday WH. Boca Raton: CRC Press Inc.; 1995. Growth Hormone. pp. 1–24, 39–54, 337–346, 351–370.
-
- Bluher S, Kratzsch J, Kiess W. Insulin-like growth factor I, growth hormone and insulin in white adipose tissue. Best Pract Res Clin Endocrinol Metab. 2005;19:577–587. - PubMed
-
- Davidson MB. Effect of growth hormone on carbohydrate and lipid metabolism. Endocr Rev. 1987;8:115–131. - PubMed
-
- Norrelund H, Nair KS, Jorgensen JO, Christiansen JS, Moller N. The protein-retaining effects of growth hormone during fasting involve inhibition of muscle-protein breakdown. Diabetes. 2001;50:96–104. - PubMed
-
- Parini P, Angelin B, Rudling M. Cholesterol and lipoprotein metabolism in aging: reversal of hypercholesterolemia by growth hormone treatment in old rats. Arterioscler Thromb Vasc Biol. 1999;19:832–839. - PubMed
Publication types
MeSH terms
Substances
LinkOut - more resources
Full Text Sources
Molecular Biology Databases
Miscellaneous

