. 2008 Jul 23;3(7):e2740.
doi: 10.1371/journal.pone.0002740.

Adaptive immune neuroprotection in G93A-SOD1 amyotrophic lateral sclerosis mice

Affiliations

Adaptive immune neuroprotection in G93A-SOD1 amyotrophic lateral sclerosis mice

Rebecca Banerjee et al. PLoS One. .

Abstract

Background: Innate neuroimmune dysfunction is a pathobiological feature of amyotrophic lateral sclerosis (ALS). However, links, if any, between disease and adaptive immunity are poorly understood. Thus, the role of T cell immunity in disease was investigated in human G93A superoxide dismutase 1 (SOD1) transgenic (Tg) mice and subsequently in ALS patients.

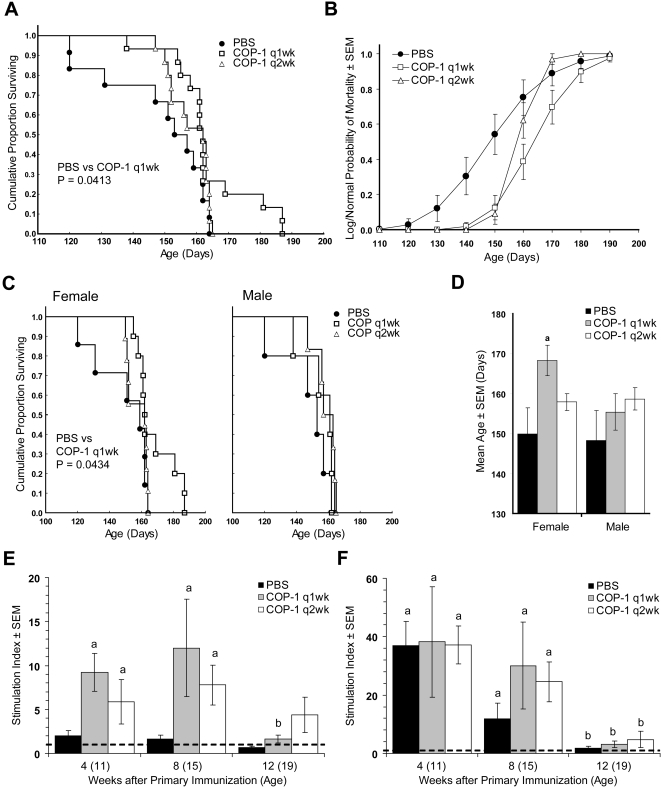
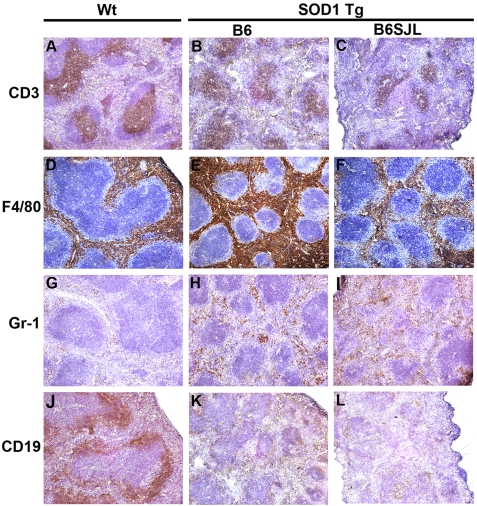
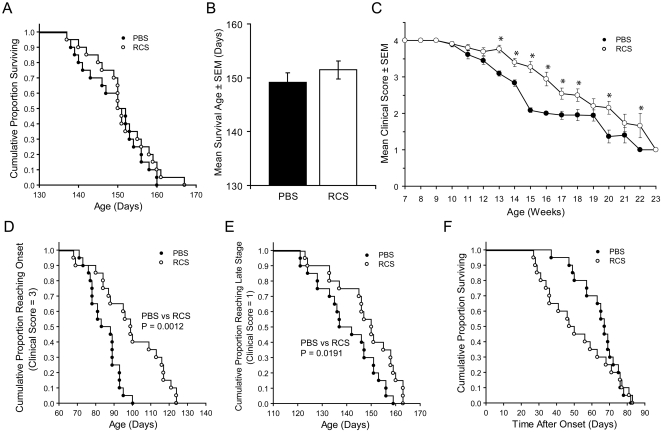
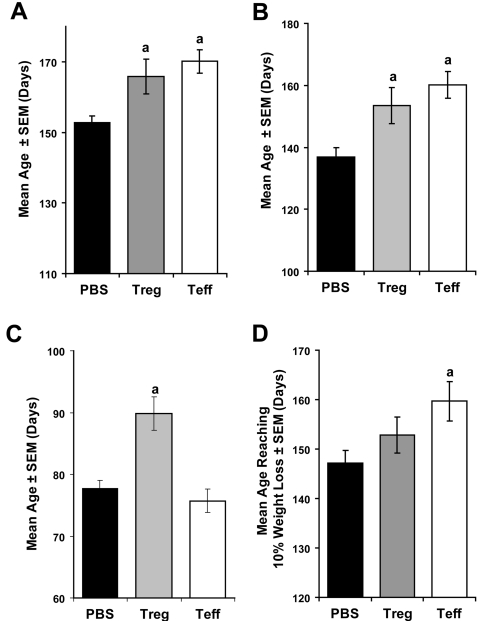
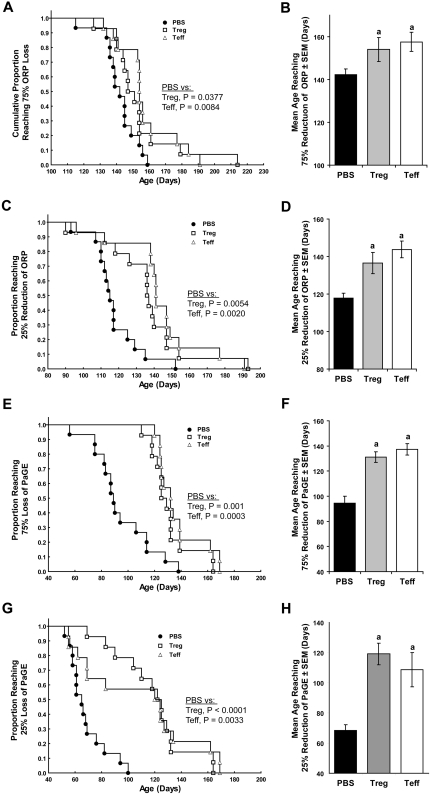
Methods and findings: Quantitative and qualitative immune deficits in lymphoid cell and T cell function were seen in G93A-SOD1 Tg mice. Spleens of Tg animals showed reductions in size, weight, lymphocyte numbers, and morphological deficits at terminal stages of disease compared to their wild-type (Wt) littermates. Spleen sizes and weights of pre-symptomatic Tg mice were unchanged, but deficits were readily seen in T cell proliferation coincident with increased annexin-V associated apoptosis and necrosis of lymphocytes. These lymphoid deficits paralleled failure of Copolymer-1 (COP-1) immunization to affect longevity. In addition, among CD4(+) T cells in ALS patients, levels of CD45RA(+) (naïve) T cells were diminished, while CD45RO(+) (memory) T cells were increased compared to age-matched caregivers. In attempts to correct mutant SOD1 associated immune deficits, we reconstituted SOD1 Tg mice with unfractionated naïve lymphocytes or anti-CD3 activated CD4(+)CD25(+) T regulatory cells (Treg) or CD4(+)CD25(-) T effector cells (Teff) from Wt donor mice. While naive lymphocytes failed to enhance survival, both polyclonal-activated Treg and Teff subsets delayed loss of motor function and extended survival; however, only Treg delayed neurological symptom onset, whereas Teff increased latency between disease onset and entry into late stage.

Conclusions: A profound and progressive immunodeficiency is operative in G93A-SOD1 mice and is linked to T cell dysfunction and the failure to elicit COP-1 neuroprotective immune responses. In preliminary studies T cell deficits were also observed in human ALS. These findings, taken together, suggest caution in ascribing vaccination outcomes when these animal models of human ALS are used for study. Nonetheless, the abilities to improve neurological function and life expectancy in G93A-SOD1 Tg mice by reconstitution with activated T cells do provide opportunities for therapeutic intervention.


Conflict of interest statement

Competing Interests: The authors have declared that no competing interests exist.

Figures

Figure 1
Figure 1. Effect of COP-1 immunization in B6 SOD1 mice.
Mice were treated with PBS (closed circles and black bars), COP-1 weekly (q1wk) (open boxes and gray bars), or COP-1 every 2 weeks (q2wk) (open triangles and white bars). (A) Kaplan-Meier analysis of the proportion of surviving SOD1 Tg mice as a function of age. Cox's F-test comparison showed groups treated with PBS vs COP-1 q1wk (p = 0.0413) or COP-1 q2wk (p = 0.1151), and COP-1 q1wk vs COP-1 q2wk (p = 0.1673). (B) Log-normal analysis of mortality probability at 10 day intervals for mice treated with PBS, COP-1 q1wk, COP-1 q2wk. (C) Kaplan-Meier plot of the proportion of surviving female SOD1 Tg mice (left panel) or male SOD1 Tg mice (right panel) as a function of age showing the gender effect. Cox's F-test comparison showed female mice groups treated with PBS vs COP-1 q1wk (p = 0.0434) or COP-1 q2wk (p = 0.2449), and COP-1 q1wk vs COP-1 q2wk (p = 0.0846) and male mice groups treated with PBS vs COP-1 q1wk (p = 0.4240) or COP-1 q2wk (p = 0.1615), and COP-1 q1wk vs COP-1 q2wk (p = 0.1430). (D) Mean age of survival±SEM for 7–10 female or 5–6 male SOD1 Tg mice/group treated with PBS, COP-1 q1wk, or COP-1 q2wk. aP<0.05 compared to PBS treated mice with Bonferroni post-hoc tests. Spleen cells from B6 Tg mice treated with PBS, COP-1 q1wk, or COP-1 q2wk were stimulated with (E) Cop-1 (5 µg/ml), (F) Con A (2 µg/ml) or cultured in media alone. Cells were pulsed with [3H]-TdR for the final 18 hrs of culture, harvested onto glass fiber filters and counted by β-scintillation spectrometry. Counts were normalized as a ratio of those obtained from culture in media alone to generate a stimulation index for spleen cell proliferation from each animal. A stimulation index of 1 is defined by spleen cells cultured in media alone (dashed line). Means of stimulation indices (±SEM) were determined from 4–5 mice/group for (E) antigen-specific proliferation elicited by Cop-1 and (F) polyclonal T cell proliferation induced by the T cell mitogen, Con A. aP<0.05, above media control (stimulation index = 1, dashed line); and bP<0.05 compared to weeks 4 or 8 within each treatment group.
Figure 2
Figure 2. Spleen changes in G93A-SOD1 Tg mice.
(A) Morphology and size of spleens from B6SJL SOD1 Tg mice and Wt littermates at 14 weeks of age (left panel) and 20 weeks of age (right panel). (B) Mean spleen weights were compared between B6SJL Wt littermates and B6SJL SOD1 Tg mice at 7, 16 and 19 weeks age and between B6 Wt and B6 SOD1 Tg mice at 22 weeks age (n = 5–9 mice/group). (C) Total spleen cell numbers were compared between Wt littermates and B6SJL SOD1 Tg mice at 14 and 22 weeks of age. Values are means±SEM for 3–9 mice per group.
Figure 3
Figure 3. Altered spleen architecture from end stage G93A-SOD1 Tg mice.
Representative photomicrographs of immunohistochemistry are shown for expression of CD3, F4/80, Gr-1, CD19 of fresh frozen spleen sections from end stage SOD1 Tg mice and age-matched Wt controls. Photomicrographs in the left panels are from B6 Wt mice, while middle and right panels show sections from B6 SOD1 Tg and B6SJL SOD1 Tg mice, respectively. Sections are stained by immunoperoxidase (brown) for expression of (A, B, C) CD3 by T cells; (D, E, F) F4/80 by perifollicular macrophages; (G, H, I) Gr-1 immunoreactivity on myeloid cells; and (J, K, L) CD19+ on B cells. Sections are counterstained with hematoxylin (blue).
Figure 4
Figure 4. Comparison of spleen architecture between Wt and SOD1 B6 Tg mice (22 weeks old).
(A) Mean area/follicle and (B) mean numbers of follicles/mm2 were determined for B6 Wt and B6 SOD1 Tg mice from digital images taken at 100× magnification (4 random fields/mouse). Densities of (C) CD3+ T cells, (D) F4/80+ macrophages, (E) Gr-1+ cells, and (F) CD19+ B cells from concomitantly stained sections were determined by digital image analysis from 100× magnifications using Image-Pro Plus software. Values are means±SEM for 3–6 mice per group.
Figure 5
Figure 5. Lymphocyte phenotype and function in G93A-SOD1 Tg mice.
The phenotype and function of splenic lymphocytes from B6SJL SOD1 Tg and Wt littermates were assessed by flow cytometric analysis (FCM) and proliferation assays. (A) Representative dot plot for FCM analysis of CD4+ gated naïve (CD44loCD62Lhi) and memory (CD44hiCD62Llo) T cells from Wt (left) and SOD1 Tg (right) mice at 14 weeks of age. (B) Mean percentages (±SEM) of CD4+ naïve and memory T cells (left panel) and ratios of naïve/memory CD4+ T cells (right panel) were determined for 5 Wt and 5 B6SJL SOD1 Tg mice. (C) Percentages of annexin-V+7ADD+ (necrotic) and annexin-V+7ADD (apoptotic) Thy-1+ T cells or CD45RB220+ B cells amongst splenic lymphocytes were assessed in Wt and B6SJL SOD1 Tg mice at 14 weeks of age. (D) Lymphoproliferative responses of Wt littermates and B6SJL SOD1 Tg mice at 14 weeks of age were evaluated after in vitro stimulation for 3 days with anti-CD3 (1 µg/ml), anti-IgM (20 µg/ml), or media alone. Stimulation indices for [3H]-TdR uptake by splenocytes from each animal were determined from quadruplicate cultures and values represent the mean±SEM for 5 mice per group.
Figure 6
Figure 6. Effect of total lymphocyte reconstitution on survival and clinical scores in B6 SOD1 Tg mice.
B6 SOD1 mice (20 mice/group) were treated with PBS (closed circles) or RCS (open circles) with 50×106 naïve splenic lymphocytes. (A) Kaplan-Meier analysis of the proportion of surviving SOD1 Tg mice as a function of age. P = 0.2035 by Cox's F-test for comparison of PBS and RCS groups. (B) Mean age of survival±SEM for 20 mice/group treated with PBS (black bar, 149.3±7.5 days) or reconstituted with naïve lymphocytes (RCS) (white bar, 151.5±7.5 days). Comparison of treatment groups indicated p = 0.315 by ANOVA. (C) Mean clinical scores (±SEM) of PBS- or RCS-treated SOD1 Tg mice as a function of age in weeks. *P<0.05 compared to PBS treated group by factorial ANOVA and Fisher's LSD post-hoc tests of treatment and age. (D) Kaplan-Meier analysis of age and cumulative proportion of SOD1 Tg mice reaching onset of disease (clinical score = 3). P = 0.0012 by Cox's F-test comparison of reconstituted mice to those treated with PBS. (E) Kaplan-Meier analysis of age and proportion of SOD1 Tg reaching late disease stage (clinical score = 1). P = 0.0191 by Cox's F-test comparison of reconstituted mice to those treated with PBS. (F) Kaplan-Meier analysis of the cumulative proportion of SOD1 Tg mice surviving after the time of disease onset (clinical score = 3). P = 0.2021 by Cox's F test comparison of RCS and those mice treated with PBS.
Figure 7
Figure 7. Effect of Treg and Teff on survival, clinical scores and weight loss in B6 SOD1 Tg mice.
B6 G93A-SOD1 mice (14–15 mice/group) were treated with PBS (closed circles), 1×10⁶ activated Treg (open boxes), or 1×10⁶ activated Teff (open triangles) at 7, 13, and 19 weeks of age. (A) Kaplan-Meier analysis of the proportion of surviving SOD1 Tg mice as a function of age. Cox's F-test comparison of groups treated with PBS vs Treg (p = 0.0054) or Teff (p = 0.0002), and Treg vs Teff (p = 0.2505). (B) Clinical scores of SOD1 Tg mice as a function of age in weeks. *P<0.05 compared to PBS treated group at each time point by factorial ANOVA and Fisher's LSD post-hoc tests. (C) Kaplan-Meier analysis for age and proportion of SOD1 Tg reaching late disease stage (clinical score = 1). Cox's F-test comparison of groups treated with PBS vs Treg (p = 0.006) or Teff (p = 0.0003), and Treg vs Teff (p = 0.1883). (D) Kaplan-Meier analysis of age and cumulative proportion of SOD1 Tg mice reaching onset of disease (clinical score = 3). Cox's F-test comparison of groups treated with PBS vs Treg (p = 0.002) or Teff (p = 0.4215), and Treg vs Teff (p = 0.0014). (E) Kaplan-Meier analysis of the cumulative proportion of SOD1 Tg mice and the time after disease onset (clinical score = 3) to reach late stage (clinical score = 1). Cox's F test comparison of groups treated with PBS vs Treg (p = 0.2716) or Teff (p = 0.0098), and Treg vs Teff (p = 0.0055). (F) Kaplan-Meier analysis of the age and the cumulative proportion of SOD1 Tg mice that exhibited a reduction of maximum body weight ≥10%. Cox's F-test comparison of groups treated with PBS vs Treg (p = 0.2131) or Teff (p = 0.003), and Treg vs Teff (p = 0.0807).
Figure 8
Figure 8. Effect of Treg and Teff on mean age of survival, clinical scores and weight loss in B6 G93A-SOD1 Tg mice.
B6 G93A-SOD1 mice were treated with PBS (black bars), 1×10⁶ activated Treg (gray bars), or 1×10⁶ activated Teff (white bars) at 7, 13, and 19 weeks of age. (A) Mean age of survival±SEM for 14–15 SOD1 Tg mice/group treated with PBS (152.7±2.0 days), Treg (165.8±5.0 days), or Teff (170.1±3.4 days). aP<0.04 compared to PBS-treated mice by ANOVA and Bonferroni post-hoc tests. (B) Mean age±SEM for SOD1 Tg mice reaching late stage (clinical score = 1) after treatment with PBS (136.9±3.1 days), Treg (153.5±5.8 days), or Teff (160.1±4.3 days). aP<0.04 compared to PBS control group by ANOVA and Bonferroni post-hoc tests. (C) Mean age±SEM for SOD1 Tg mice at disease onset (clinical score = 3) after treatment with PBS (77.7±1.3 days), Treg (89.8±2.7 days), or Teff (75.7±1.9 days). aP = 0.0003 compared to PBS control group by ANOVA and Bonferroni post-hoc tests. (D) Mean age±SEM for SOD1 Tg mice that exhibit a reduction of maximum body weight ≥10% after treatment with PBS (147.2±2.5 days), Treg (152.8±3.7 days), or Teff (159.7±4.0 days). aP<0.04 compared to PBS control group by ANOVA and Bonferroni post-hoc tests.
Figure 9
Figure 9. Effect of Treg and Teff on motor function in B6 G93A-SOD1 Tg mice.
B6 G93A-SOD1 mice (14–15 mice/group) were treated at 7, 13, and 19 weeks of age with PBS (closed circles and black bars), 1×10⁶ activated Treg (open boxes and gray bars), or 1×10⁶ activated Teff (open triangles and white bars). (A) Kaplan-Meier analysis of the age and the cumulative proportion of SOD1 Tg mice that exhibited a ≥75% reduction of overall rotarod performance (ORP). Cox's F-test comparison of groups treated with PBS vs Treg (p = 0.0377) or Teff (p = 0.0084), and Tregs vs Teffs (p = 0.27). (B) Mean age±SEM for 14–15 SOD1 Tg mice/group at which mice exhibited a ≥75% reduction in ORP after treatment with PBS (142.1±2.8 days), Treg (154.0±5.6 days), or Teff (157.5±4.4 days). aP<0.05 compared to PBS treated mice by ANOVA and Bonferroni post-hoc tests. (C) Kaplan-Meier analysis of ages and cumulative proportion of SOD1 Tg mice that exhibited ≥25% reduction in ORP. Cox's F-test comparison of groups treated with PBS vs Treg (p = 0.0054) or Teff (p = 0.0020), and Treg vs Teff (p = 0.20). (D) Mean age±SEM for 14–15 SOD1 Tg mice/group at which mice exhibited ≥25% reduction in ORP after treatment with PBS (117.7±3.5 days), Treg (136.5±6.2 days), or Teff (143.7±6.1 days). aP<0.0025 compared to PBS treated mice by ANOVA and Bonferroni post-hoc tests. (E) Kaplan-Meier analysis for age and proportion of SOD1 Tg mice that exhibited ≥75% reduction of maximum Paw Grip Endurance (PaGE) after treatment with PBS, Treg, or Teff. Cox's F test comparison of groups treated with PBS vs Treg (p = 0.001) or Teff (p = 0.0003), and Treg vs Teff (p = 0.14). (F) Mean age±SEM for SOD1 Tg mice that exhibited ≥75% reduction of maximum PaGE after treatment with PBS (94.5±5.6 days), Treg (131.1±4.2 days), or Teff (137.2±4.5 days). aP<0.0001 compared to PBS control group by ANOVA and Bonferroni post-hoc tests. (G) Kaplan-Meier analysis for age (days) and proportion of SOD1 Tg mice that exhibited ≥25% reduction of maximum PaGE after treatment with PBS, Treg, or Teff. Cox's F test comparison of groups treated with PBS vs Treg (p<0.0001) or Teff (p = 0.0033), and Treg vs Teff (p = 0.42). (H) Mean age±SEM at which SOD1 Tg mice exhibited at least 25% reduction of maximum PaGE after treatment with PBS (68.5±3.6 days), Treg (119.1±7.2 days), or Teff (108.7±11.3 days). aP<0.002 compared to PBS control group by ANOVA and Dunnett's post-hoc tests.

References

    1. Boillee S, Vande Velde C, Cleveland DW. ALS: a disease of motor neurons and their nonneuronal neighbors. Neuron. 2006;52:39–59. - PubMed
    1. Lobsiger CS, Cleveland DW. Glial cells as intrinsic components of non-cell-autonomous neurodegenerative disease. Nat Neurosci. 2007;10:1355–1360. - PMC - PubMed
    1. Rosen DR, Siddique T, Patterson D, Figlewicz DA, Sapp P, et al. Mutations in Cu/Zn superoxide dismutase gene are associated with familial amyotrophic lateral sclerosis. Nature. 1993;362:59–62. - PubMed
    1. Gurney ME, Pu H, Chiu AY, Dal Canto MC, Polchow CY, et al. Motor neuron degeneration in mice that express a human Cu,Zn superoxide dismutase mutation. Science. 1994;264:1772–1775. - PubMed
    1. Hall ED, Oostveen JA, Gurney ME. Relationship of microglial and astrocytic activation to disease onset and progression in a transgenic model of familial ALS. Glia. 1998;23:249–256. - PubMed

Publication types

Substances