

A large-scale rheumatoid arthritis genetic study identifies association at chromosome 9q33.2
- PMID: 18648537
- PMCID: PMC2481282
- DOI: 10.1371/journal.pgen.1000107
A large-scale rheumatoid arthritis genetic study identifies association at chromosome 9q33.2
Abstract
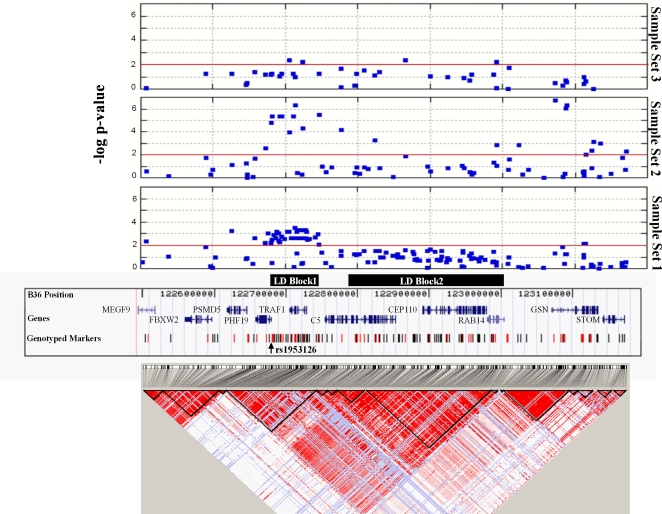
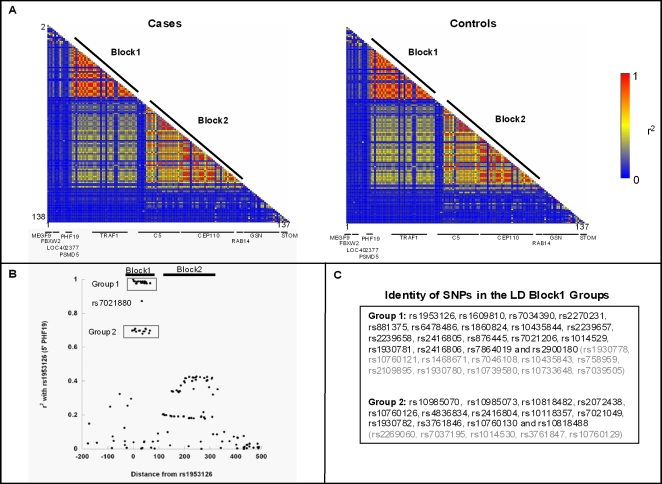
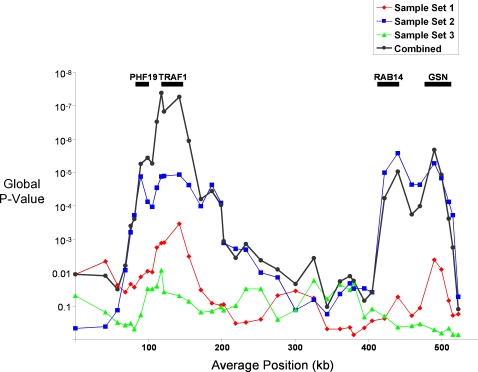
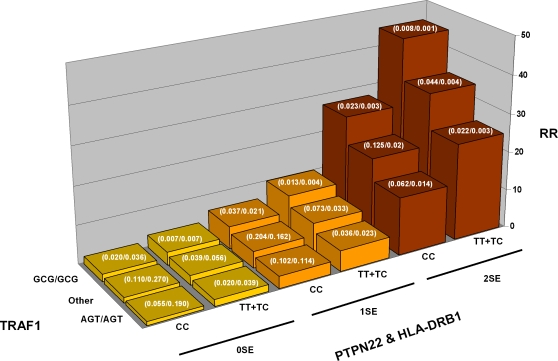
Rheumatoid arthritis (RA) is a chronic, systemic autoimmune disease affecting both joints and extra-articular tissues. Although some genetic risk factors for RA are well-established, most notably HLA-DRB1 and PTPN22, these markers do not fully account for the observed heritability. To identify additional susceptibility loci, we carried out a multi-tiered, case-control association study, genotyping 25,966 putative functional SNPs in 475 white North American RA patients and 475 matched controls. Significant markers were genotyped in two additional, independent, white case-control sample sets (661 cases/1322 controls from North America and 596 cases/705 controls from The Netherlands) identifying a SNP, rs1953126, on chromosome 9q33.2 that was significantly associated with RA (OR(common) = 1.28, trend P(comb) = 1.45E-06). Through a comprehensive fine-scale-mapping SNP-selection procedure, 137 additional SNPs in a 668 kb region from MEGF9 to STOM on 9q33.2 were chosen for follow-up genotyping in a staged-approach. Significant single marker results (P(comb)<0.01) spanned a large 525 kb region from FBXW2 to GSN. However, a variety of analyses identified SNPs in a 70 kb region extending from the third intron of PHF19 across TRAF1 into the TRAF1-C5 intergenic region, but excluding the C5 coding region, as the most interesting (trend P(comb): 1.45E-06 --> 5.41E-09). The observed association patterns for these SNPs had heightened statistical significance and a higher degree of consistency across sample sets. In addition, the allele frequencies for these SNPs displayed reduced variability between control groups when compared to other SNPs. Lastly, in combination with the other two known genetic risk factors, HLA-DRB1 and PTPN22, the variants reported here generate more than a 45-fold RA-risk differential.
Conflict of interest statement
MC, CMR, VEG, SJS, JJC and ABB are employees of Celera and, as such, may own stock and/or stock options in Celera.
Figures
References
-
- Firestein GS. Evolving concepts of rheumatoid arthritis. Nature. 2003;423:356–361. - PubMed
-
- Scott DL, Kingsley GH. Tumor necrosis factor inhibitors for rheumatoid arthritis. N Engl J Med. 2006;355:704–712. - PubMed
-
- Callahan LF, Pincus T. Mortality in the rheumatic diseases. Arthritis Care Res. 1995;8:229–241. - PubMed
-
- MacGregor AJ, Snieder H, Rigby AS, Koskenvuo M, Kaprio J, et al. Characterizing the quantitative genetic contribution to rheumatoid arthritis using data from twins. Arthritis Rheum. 2000;43:30–37. - PubMed
Publication types
MeSH terms
Substances
Grants and funding
LinkOut - more resources
Full Text Sources
Other Literature Sources
Medical
Research Materials
Miscellaneous
