. 2008 Jun 25;3(6):e2502.
doi: 10.1371/journal.pone.0002502.

Climate change and the future of California's endemic flora

Affiliations

Climate change and the future of California's endemic flora

Scott R Loarie et al. PLoS One. .

Abstract

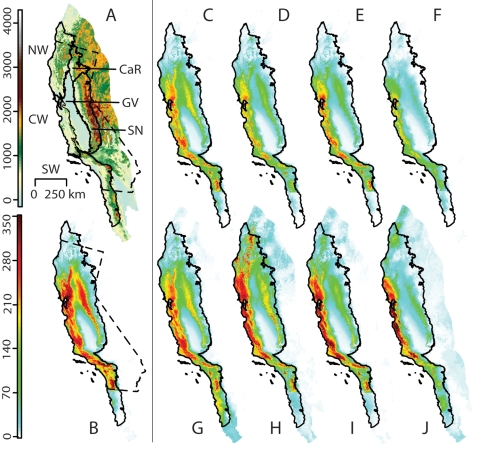
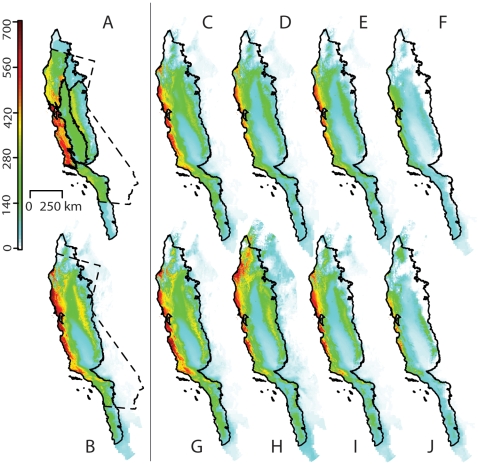
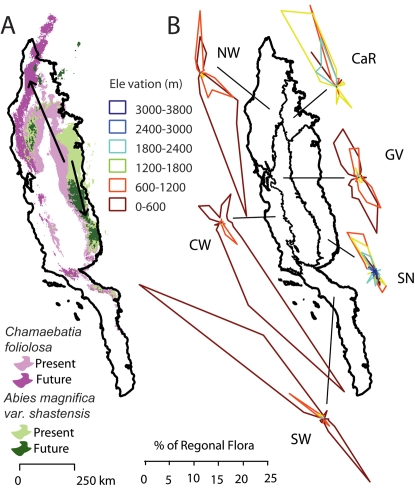
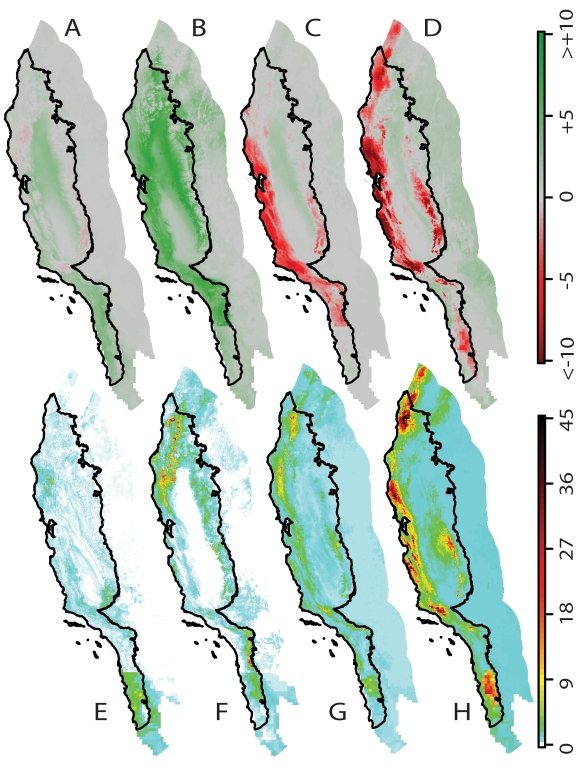
The flora of California, a global biodiversity hotspot, includes 2387 endemic plant taxa. With anticipated climate change, we project that up to 66% will experience >80% reductions in range size within a century. These results are comparable with other studies of fewer species or just samples of a region's endemics. Projected reductions depend on the magnitude of future emissions and on the ability of species to disperse from their current locations. California's varied terrain could cause species to move in very different directions, breaking up present-day floras. However, our projections also identify regions where species undergoing severe range reductions may persist. Protecting these potential future refugia and facilitating species dispersal will be essential to maintain biodiversity in the face of climate change.


Conflict of interest statement

Competing Interests: The authors have declared that no competing interests exist.

Figures

Figure 1
Figure 1. Study area and Maxent diversity projections of the best known 591 species.
(A) The province divided into six floristic regions (solid lines): Northwestern California (NW), Central Western California (CW), Southwestern California (SW), the Cascade Ranges (CaR), the Great Central Valley (GV), and the Sierra Nevada (SN). The province includes most of California (dashed line) and portions of Oregon and Mexico. We include a surrounding buffer of equal area (colored areas outside solid line). Colors represent elevation in meters. (B) Projected present diversity. (C–J) Projected diversity 80 years from now modeled with increasing amounts of future climate change: (C–F) Plants cannot disperse. (G–J) Plants can disperse to all suitable areas. (C, F, G, H) Simulations based on the lower sensitivity PCM model. (E, F, I, J) Simulations based on the higher-sensitivity HadCM3 model. (C, E, G, I) Lower emissions scenario (B1). (D, F, H, J) Higher emissions scenario (A1FI).
Figure 2
Figure 2. (A) Present diversity from range maps for all California Floristic Province endemic species (2387).
(B) Projected present diversity from the Multi-level Generalized Linear Model for all species with >2 specimens (2068). (C–J) Projected diversity 80 years from now modeled with increasingly increasing amounts of future climate change: (C–F) Plants cannot disperse. (G–J) Plants can disperse to all suitable areas. (C, F, G, H) Simulations based on the lower sensitivity PCM model. (E, F, I, J) Simulations based on the higher-sensitivity HadCM3 model. (C, E, G, I) Lower emissions scenario (B1). (D, F, H, J) Higher emissions scenario (A1FI).
Figure 3
Figure 3. Movement of species geographic centroids based on HadCM3 simulations using the A1FI emission scenario 80 years in the future and assuming species can move.
(A) Two representative species that have adjacent present ranges (lighter colors) and are projected to move in opposing directions (arrows and darker colors). (B) Projected centroid movements for all species. Individual polar plots group species by the floristic region in which their centroid originates. Within each plot, species are grouped by the elevation in which their centroids originate. The magnitude of the directions represents the percentage of the regional flora moving in each direction.
Figure 4
Figure 4. Future patterns of range size changes across increasing levels of climate change in which species can move.
(A - D) Percent geometric mean change in range size (Future/Present with colors stretched from a <-10% decrease to a >10% increase). (E - H) Diversity of species gains (future diversity with migration minus future diversity without migration) for the quarter species suffering the largest range contractions. (A, B, E, F) Simulations based on the lower-sensitivity PCM model. (C, D, G, H) Simulations based on the higher-sensitivity HadCM3 model. (A, C, E, G) Lower emissions (B1). (B, D, F, H) Higher emissions (A1FI).

References

    1. Myers N, Mittermeier RA, Mittermeier CG, de Fonseca GAB, Kent J. Biodiversity hotspots for conservation priorities. Nature. 2000;403:853–858. - PubMed
    1. Hickman JC. The Jepson manual: higher plants of California. Berkeley: University of California Press; 1993.
    1. Hayhoe K, Cayan D, Field CB, Frumhoff PC, Maurer EP, et al. Emissions pathways, climate Change, and impacts on California. Proc Natl Acad Sci USA. 2004;101:12422–12427. - PMC - PubMed
    1. Parmesan C. Climate and species' range. Nature. 1996;382:765–766.
    1. Schneider SH, Root TL. Wildlife responses to climate change. Washington, D.C.: Island Press; 2001.