. 2006 May 1;3(3):425-42.
doi: 10.2203/dose-response.003.03.010.

Cell proliferation, reactive oxygen and cellular glutathione

Affiliations

Cell proliferation, reactive oxygen and cellular glutathione

Regina M Day et al. Dose Response. .

Abstract

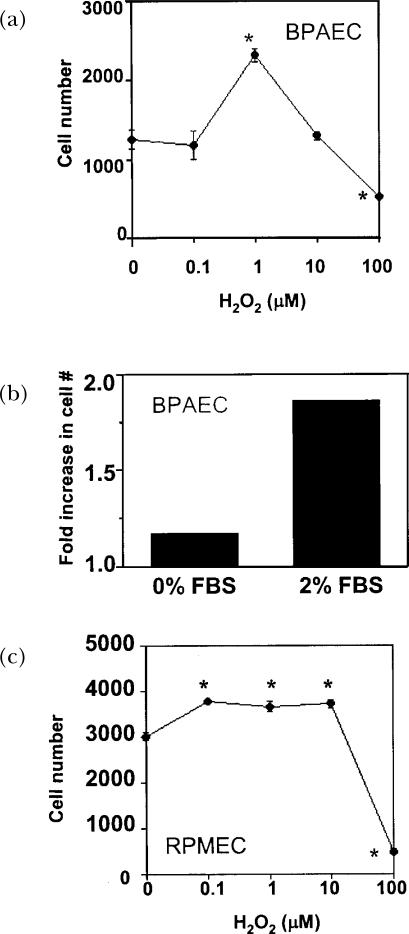
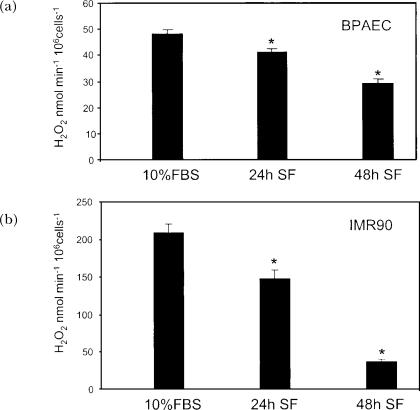
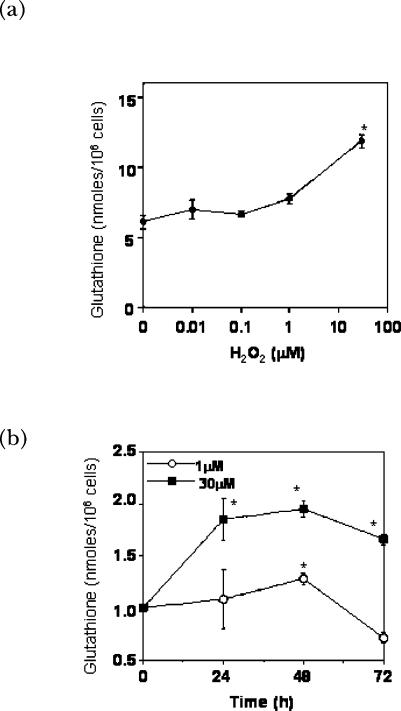
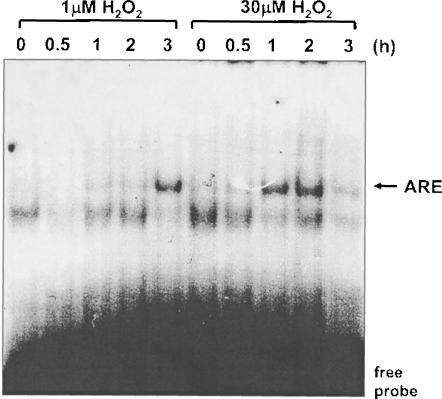
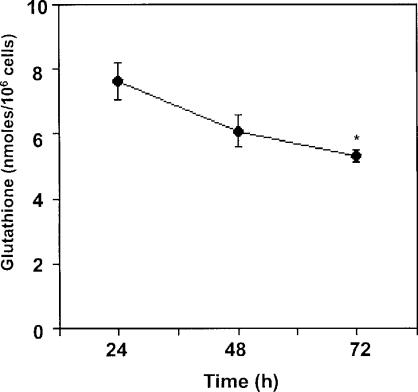
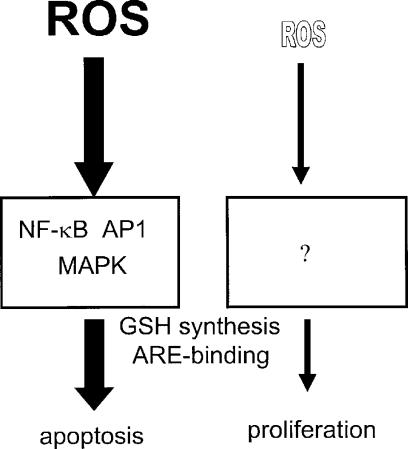
A variety of cellular activities, including metabolism, growth, and death, are regulated and modulated by the redox status of the environment. A biphasic effect has been demonstrated on cellular proliferation with reactive oxygen species (ROS)-especially hydrogen peroxide and superoxide-in which low levels (usually submicromolar concentrations) induce growth but higher concentrations (usually >10-30 micromolar) induce apoptosis or necrosis. This phenomenon has been demonstrated for primary, immortalized and transformed cell types. However, the mechanism of the proliferative response to low levels of ROS is not well understood. Much of the work examining the signal transduction by ROS, including H(2)O(2), has been performed using doses in the lethal range. Although use of higher ROS doses have allowed the identification of important signal transduction pathways, these pathways may be activated by cells only in association with ROS-induced apoptosis and necrosis, and may not utilize the same pathways activated by lower doses of ROS associated with increased cell growth. Recent data has shown that low levels of exogenous H(2)O(2) up-regulate intracellular glutathione and activate the DNA binding activity toward antioxidant response element. The modulation of the cellular redox environment, through the regulation of cellular glutathione levels, may be a part of the hormetic effect shown by ROS on cell growth.

Keywords: MAPK; antioxidant response element; biphasic response; oxidative stress; signal transduction.


Figures

FIGURE 1
FIGURE 1
Effects of H2O2 on bovine PAEC and RPMEC growth. (A) Bovine PAEC (BPAEC) were treated with varied concentrations of H2O2 for 48 h in medium containing 2% FBS. (B) BPAEC were treated with 1 μM H2O2 for 48 h in medium containing 0 or 2% FBS. (C) RPMEC were treated with varied concentrations of H2O2 for 48 h in medium containing 2% FBS. The number of cells was determined by Coulter counting. Values represent means ± SE, n=3. Values differ from the 0 μM H2O2 control at p<0.05. Work of Day et al. is being reproduced with permission (Day et al., 2003).
FIGURE 2
FIGURE 2
Effect of growth arrest on endogenous production of extracellular H2O2 by bovine PAEC and IMR90. Bovine PAEC (BPAEC) (A) or IMR90 human lung fibroblasts (B) were subcultured at 4×10⁴ cells/35 mm dish in RPMI supplemented with 10% FBS. 24 h and 48 h after plating, medium was replaced with serum free (SF) RPMI. Extracellular H2O2 was determined as described previously (Thannickal et al., 1993), and normalized to cell numbers. Briefly, cells were washed with Hanks' buffered saline, without phenol red, pH 7.4. Cells were then placed in Hanks saline containing 1mM HEPES, 100 μM homovanillic acid, 5 units/ml horseradish peroxidase, type IV. The conditioned medium was collected after 1 h, and the pH was adjusted to 10.0 with 0.1 M glycine-NaOH buffer. Fluorescence was measured at excitation and emission wavelengths of 321nm and 421nm, respectively. Control samples were made containing the reaction mixture alone, and incubated in the absence of cells to correct for spontaneous dimerization of homovanillic acid. A standard curve was generated using known concentrations of H2O2 incubated with the reaction solution. Values represent means ± SD, n=3. Values differ from 10% FBS at p<0.05.
FIGURE 3
FIGURE 3
Effects of H2O2 on cellular glutathione content. (A) Bovine PAEC (BPAEC) were treated with varied concentrations of H2O2 for 48 h in medium containing 2% FBS. Levels of total glutathione were determined as previously described (Day et al., 2003). Briefly, cells were detached from dishes using trypsin/EDTA to produce a cell suspension. A portion of the suspension was used to obtain a cell count while the remaining cells were treated with 1% perchloric acid. The perchloric acid supernatants were sonicated on ice and adjusted to pH 7. Total glutathione was measured in a kinetic assay using glutathione reductase, β-NADPH and gluthathione disulfide. The reduction of 5,5′-dithiobis(2-nitrobenzoic acid) was followed spectrophotometrically at 412 nm. Values represent means ± SD, n=3; experiments were performed at least 3 times. Values differ from 0 μM H2O2 at p<0.05. (B) Bovine PAEC were treated with 1 or 30 μM H2O2 for the durations indicated. The graph shows means ± SE, n=3, of fold increase in glutathione. Values differ from 0 time point at p<0.05. Work is being reproduced with permission (Day et al., 2003).
FIGURE 4
FIGURE 4
Effects of H2O2 on ARE binding. Bovine PAEC were treated with the indicated concentrations of H2O2 for 0.5 to 3 h. Nuclear extracts were prepared and DNA-binding activity to an ARE consensus oligo was monitored by EMSA. To prepare nuclear extracts, cells were washed in PBS and incubated in 10 mM Hepes (pH 7.8), 10 mM KCl, 2 mM MgCl2, 0.1 mM EDTA, 0.1 mM phenylmethylsulfonyl fluoride, 5 μg/ml leupeptin, 10 μg/ml aprotinin, 1 mM NaF, 0.1 mM sodium orthovanadate, and 1 mM tetrasodiumphyrphosphate for 15 min at 4°C. IGEPAL CA-630 was then added at a final concentration of 0.6% (v/v). Samples centrifuged and pelleted nuclei were resuspended in extraction buffer (50 mM Hepes (pH 7.8), 50 mM KCl, 300 mM NaCl, 0.1 mM EDTA, 0.1 mM phenyl-methylsulfonyl fluoride, 5 μg/ml leupeptin, 10 μg/ml aprotinin, 1 mM NaF, 0.1 mM sodium orthovanadate, and 1 mM tetrasodiumphyrphosphate, and 1% glycerol) and mixed vigorously for 20 min, 4°C, and centrifuged for 5 min. Supernatants were harvested and protein concentrations were determined. To perform EMSA binding reaction, mixtures containing 2 μg nuclear extract protein were incubated with 1 μg poly(dI-dC)·poly(dI-dC) and 32P-labeled double-stranded oligonucleotide containing a consensus sequence for ARE in 100 mM NaCl, 1 mM EDTA, 1 mM dithiothreitol, 10% glycerol (v/v), and 20 mM Tris-HCl (pH 7.5) for 20 min at 25°C. Electrophoresis of samples through a native 6% polyacrylramide gel was followed by autoradiography. This work is being reproduced with permission (Day et al., 2003). The primary species binding to the ARE in PAEC was previously identified to be Nrf-2 (Day et al., 2002).
FIGURE 5
FIGURE 5
Effects of cell density on glutathione content. Bovine PAEC were grown for the durations indicating after plating at 4×10⁴ cells/35 mm dish in RPMI supplemented with 10% FBS. Total cellular glutathione was measured as stated in Figure 3. Values represent means ± SE, n=3. Values differ from the 24 h value at p<0.05. Work is being reproduced with permission (Day et al., 2003).
FIGURE 6
FIGURE 6
Scheme of biphasic ROS signal transduction. High levels of ROS (left side) induce activation of multiple MAP kinases and activate transcription factors including AP-1 and NF-κB; these pathways lead to apoptosis or necrosis. Low doses of ROS (right side) cause cell proliferation, but the signal transduction pathways involved are unknown. Both high and low doses of ROS up-regulate cellular glutathione and activate DNA-binding to the ARE element.

Similar articles

Cited by

References

    1. Anderson M.T., Staal F.J., Gitler C., Herzenberg L.A. Separation of oxidant-initiated and redox-regulated steps in the NF-kappa B signal transduction pathway. Proc Natl Acad Sci U S A. 1994;91:11527–31. - PMC - PubMed
    1. Arnold R.S., Shi J., Murad E., Whalen A.M., Sun C.Q., Polavarapu R., Parthasarathy S., Petros J.A., Lambeth J.D. Hydrogen peroxide mediates the cell growth and transformation caused by the mitogenic oxidase Nox1. Proc Natl Acad Sci U S A. 2001;98:5550–5. - PMC - PubMed
    1. Babior B.M. The NADPH oxidase of endothelial cells. IUBMB Life. 2000;50:267–9. - PubMed
    1. Bayraktutan U., Blayney L., Shah A.M. Molecular characterization and localization of the NAD(P)H oxidase components gp91-phox and p22-phox in endothelial cells. Arterioscler Thromb Vasc Biol. 2000;20:1903–11. - PubMed
    1. Boonstra J., Post J.A. Molecular events associated with reactive oxygen species and cell cycle progression in mammalian cells. Gene. 2004;337:1–13. - PubMed

LinkOut - more resources