. 2008 Jul 23;3(7):e2779.
doi: 10.1371/journal.pone.0002779.

Deleted in liver cancer 1 (DLC1) negatively regulates Rho/ROCK/MLC pathway in hepatocellular carcinoma

Affiliations

Deleted in liver cancer 1 (DLC1) negatively regulates Rho/ROCK/MLC pathway in hepatocellular carcinoma

Carmen Chak-Lui Wong et al. PLoS One. .

Abstract

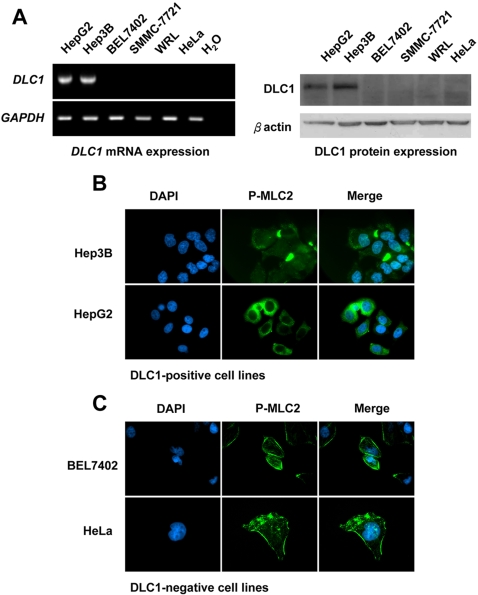
Aims: Deleted in liver cancer 1 (DLC1), a member of RhoGTPase activating protein (GAP) family, is known to have suppressive activities in tumorigenicity and cancer metastasis. However, the underlying molecular mechanisms of how DLC1 suppresses cell motility have not been fully elucidated. Rho-kinase (ROCK) is an immediate down-stream effector of RhoA in mediating cellular cytoskeletal events and cell motility. In the present study, we aimed to investigate the effects of DLC1 on Rho/ROCK signaling pathway in hepatocellular carcinoma (HCC).

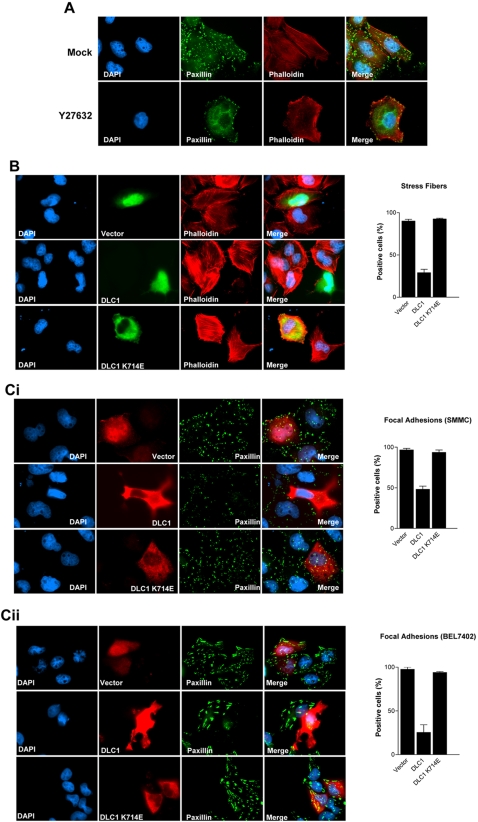
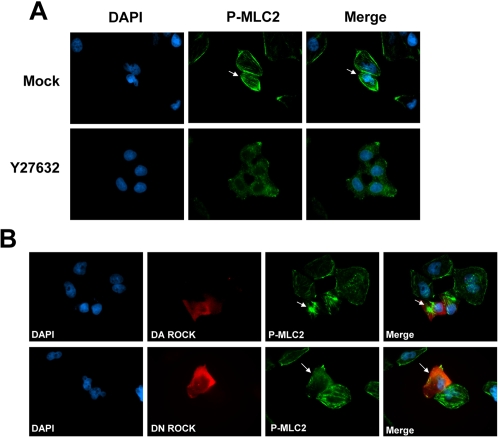
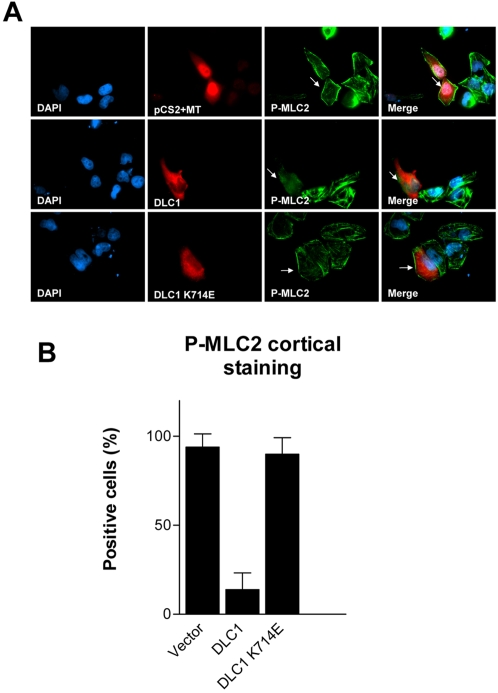
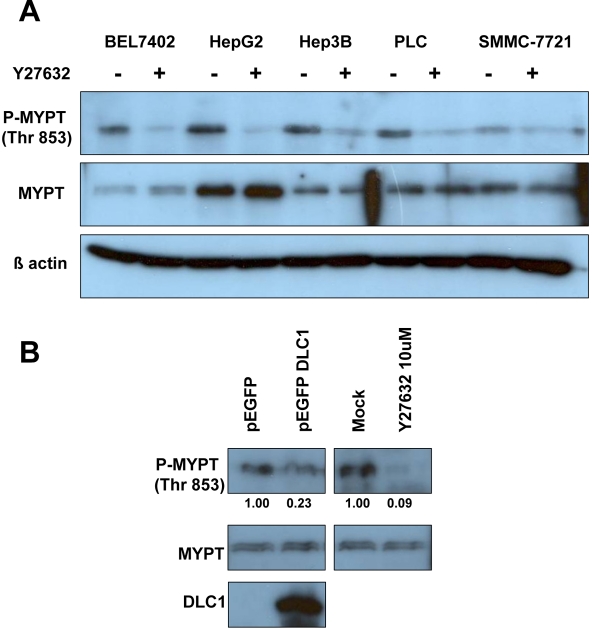
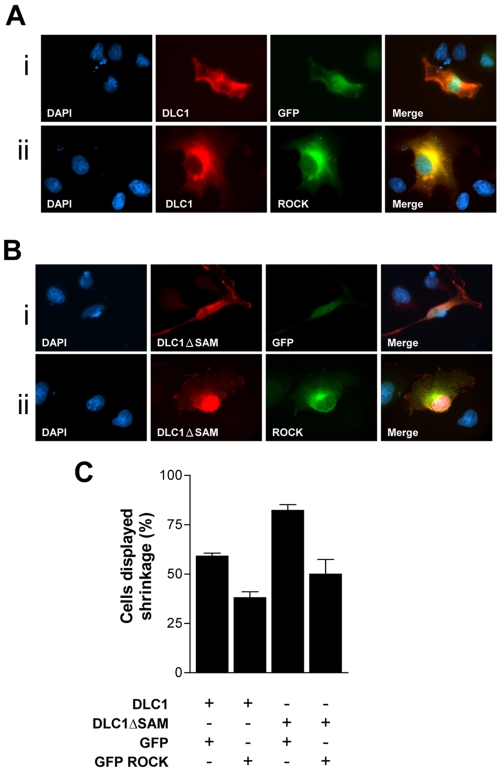
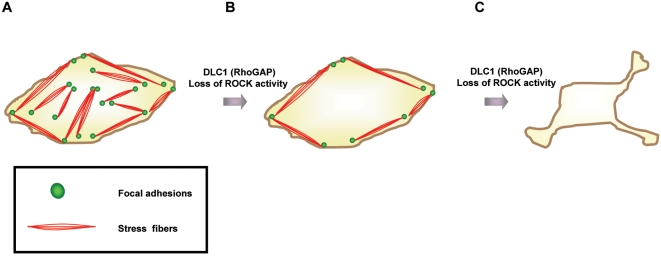
Methodology/principal findings: We demonstrated that DLC1 negatively regulated ROCK-dependent actomyosin contractility. From immunofluorescence study, we found that ectopic expression of DLC1 abrogated Rho/ROCK-mediated cytoskeletal reorganization including formation of stress fibers and focal adhesions. It also downregulated cortical phosphorylation of myosin light chain 2 (MLC2). These inhibitory events by DLC1 were RhoGAP-dependent, as RhoGAP-deficient mutant of DLC1 (DLC1 K714E) abolished these inhibitory events. In addition, from western study, DLC1 inhibited ROCK-related myosin light chain phosphatase targeting unit 1 (MYPT1) phosphorylation at Threonine 853. By examining cell morphology under microscope, we found that ectopic expression of dominant-active ROCK released cells from DLC1-induced cytoskeletal collapse and cell shrinkage.

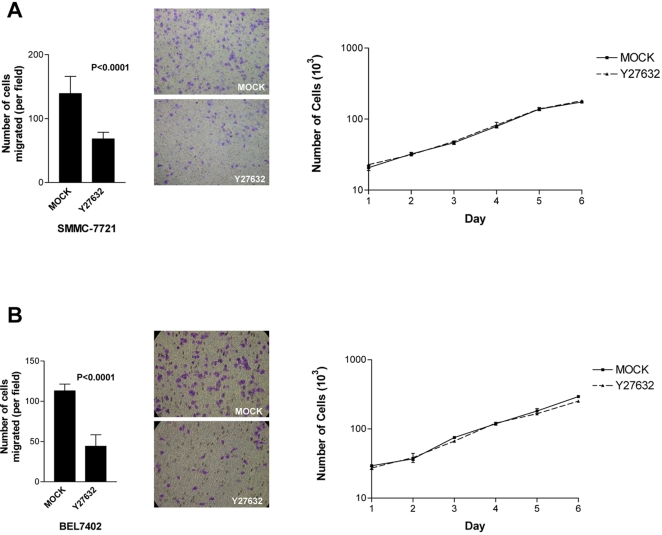
Conclusion: Our data suggest that DLC1 negatively regulates Rho/ROCK/MLC2. This implicates a ROCK-mediated pathway of DLC1 in suppressing metastasis of HCC cells and enriches our understanding in the molecular mechanisms involved in the progression of hepatocellular carcinoma.


Conflict of interest statement

Competing Interests: The authors have declared that no competing interests exist.

Figures

Figure 1
Figure 1. DLC1 abolished ROCK-mediated stress fiber and focal adhesion formation.
(A) ROCK inhibitor suppressed stress fiber and focal adhesion formation in HCC cells. SMMC-7721 cells were seeded onto cover-slip one day before treatment. Stress fibers were stained with phalloidin stain (red) and focal adhesions with paxillin stain (green). Stress fibers could be clearly observed as bundles stretching across the cells and focal adhesions were attached to the stress fiber bundling arrays in SMMC-7721 mock treated control. Treatment with ROCK inhibitor Y27632 at 10 µM for 60 minutes suppressed formation of stress fiber and focal adhesion network in SMMC-7721. (B) and (C) DLC1 suppressed ROCK-mediated stress fiber and focal adhesion formation in HCC cells. SMMC-7721 cells (i) and BEL7402 (ii) were transfected with myc-tagged expression plasmids, pCS2+MT, pCS2+MT/DLC1, and pCS2+MT/DLC1 K714E, and recognized by anti-myc antibodies (9E10). Stress fibers and focal adhesions were stained with phalloidin-TRITC and anti-paxillin antibody, respectively. Wild-type DLC1, but not RhoGAP-deficient mutant (DLC1 K714E), suppressed stress fibers formation and reduced the number of stress fibers-linked focal adhesions formed in SMMC-7721 cells. Percentage of different DLC1 constructs transfected cells exhibiting stress fibers or focal adhesions were presented in a bar graph accordingly. For each construct, total 67–170 transfected cells were counted under microscope. Error bars represent standard deviation (SD) of data obtained from two independent experiments.
Figure 2
Figure 2. ROCK-mediated cortical phosphorylation of MLC2.
(A) BEL4702 HCC cell line treated with mock control or ROCK inhibitor (Y27632) was probed with mouse monoclonal antibody against phospho-MLC2 (Ser 19). Phospho-MLC2 (green) was mainly detected at the cell cortex of BEL7402 cells (as indicated by the arrows) and this cortical staining pattern was abolished by treatment with ROCK inhibitor Y27632. (B) BEL7402 cells were transfected with myc-tagged dominant negative ROCK or dominant active ROCK constructs and detected with rabbit polyclonal antibody against myc-epitope (A14) (Red). Dominant active (DA) ROCK caused intense phosphorylation of MLC2 (Ser 19) at the actin bundles (Precentage of cells exhibiting this phenomenon: 94.0% of the DA ROCK-transfected cells compared to 0% of the vector transfected cells). Arrows point at the actin bundles of the dominant active ROCK transfected cell where phosphorylation of MLC2 (Ser 19) was enhanced. Dominant negative (DN) ROCK suppressed cortical phosphorylation of MLC2 (Ser 19) (Percentage of cells exhibiting this phenomenon: 87.5% of the DN ROCK-transfected cells compared to 7.3% of the vector transfected cells). Arrows point at the cell cortex of the dominant negative ROCK transfected cell where phosphorylation of MLC2 (Ser 19) was lost. As shown, a tight regulation and an optimal level of ROCK activity were required to maintain cortical phosphorylation of MLC2 (Ser 19) in BEL7402 cells.
Figure 3
Figure 3. DLC1 expression was associated with cortical phosphorylation of MLC2.
(A) DLC1 mRNA and protein expression in HCC cell lines. (B) and (C) DLC1 expression was associated with phospho-MLC2 staining pattern. Representative pictures from DLC1-positive and DLC1-negative cells, respectively. DLC1-positive Hep3B and HepG2, displayed diffuse phosphorylation of MLC2, whereas DLC1 non-expressing BEL7402 and HeLa, displayed pronounced cortical phosphorylation of MLC2 at cell cortex.
Figure 4
Figure 4. DLC1 RhoGAP was responsible for regulating cortical phosphorylation of MLC2.
(A) pCS2+MT vector alone, pCS2+MT DLC1, and pCS2+MT DLC1 K714E, respectively, were transfected into BEL7402 cells. Recognition of transfected cells was done by probing cells with c-myc (A14) rabbit antibody followed by staining with anti-rabbit antibody conjugated with Texas Red. Cells transfected with pCS2+MT vector alone displayed pronounced cortical phosphorylation of MLC2 as indicated by the arrows. Cells transfected with DLC1 displayed loss of cortical phosphorylation of MLC2. Cells transfected with DLC1 K714E, the RhoGAP-deficient mutant, still displayed pronounced cortical phosphorylation of MLC2 as indicated by the arrows. (B) Percentage of different DLC1 constructs exhibiting cortical phosphorylation of MLC2 at Ser 19 was calculated and presented in a bar graph. For each construct, 80–100 transfected cells were counted and cortical MLC2 phosphorylation was recorded. Error bars represent standard deviation (SD) of data obtained from three independent experiments.
Figure 5
Figure 5. DLC1 and ROCK regulated MYPT phosphorylation.
(A) ROCK inhibitor Y27632 suppressed MYPT phosphorylation at Thr 853 in all HCC cell lines. (B) DLC1 suppressed MYPT phosphorylation at Thr 853 in 293 T cells. Band intensity was analyzed by AlphaEaseFC™ and percentage was calculated from comparison with its according control.
Figure 6
Figure 6. ROCK inhibitor suppressed HCC cell migration.
ROCK inhibitor Y27632 suppressed HCC cell migration. Y27632 decreased number of migrated (A) SMMC-7721 cells (P<0.0001, t-test) and (B) BEL7402 cells (P<0.0001, t-test). Error bars represent standard deviation (SD) of data obtained from three microscopic fields. Experiments have been repeated three times. Cell proliferation assay was shown on the right to compare growth rate of mock control cells and Y27632 treated cells.
Figure 7
Figure 7. ROCK reversed the cell morphological alteration of DLC1.
COS7 cells were co-transfected with (A) DLC1 and ROCK or (B) DLC1ΔSAM and ROCK, respectively. Cells transfected with pCS2MT DLC1 or pCS2MT DLC1ΔSAM appeared red, while cells transfected with pEGFP or pEGFP ROCK appeared green. DLC1-induced cell cytoskeletal collapse or cell shrinkage (A-i), which was further enhanced and clearly demonstrated by SAM-deleted construct, pCS2+MT DLC1ΔSAM (B-i). ROCK was able to restore cells from DLC1-induced cell shrinkage (A-ii) and even from DLC1ΔSAM-induced intense cell shrinkage (B-ii). (C) Co-transfected cells were counted and their morphologies recorded. The number of co-transfected cells displaying observable cell shrinkage (cell collapse) was divided by total number of co-transfected cells counted, to calculate the percentage of cells in displaying shrinkage as shown in the bar graph. For each column, 150–200 co-transfected cells were counted. Error bars represent standard deviation (SD) of data obtained from three independent experiments.
Figure 8
Figure 8. Model of DLC1 induced cytoskeletal collapse.
(A) Stress fibers were connected to focal adhesions forming a network. Stress fibers stretched across the cell to provide the cell an intact morphology. (B) DLC1 RhoGAP or loss of ROCK activity induced the loss of stress fibers and focal adhesions. A few focal adhesions and bundles of stress fibers remained. (C) A prolonged or severe loss of stress fiber and focal adhesion network caused by DLC1 RhoGAP or suppression of ROCK activity would result in intensive cytoskeletal collapse. All the stress fibers and focal adhesions were abolished.

Similar articles

Cited by

References

    1. Ananthakrishnan R, Ehrlicher A. The forces behind cell movement. Int J Biol Sci. 2007;3:303–317. - PMC - PubMed
    1. Yamazaki D, Kurisu S, Takenawa T. Regulation of cancer cell motility through actin reorganization. Cancer Sci. 2005;96:379–386. - PMC - PubMed
    1. Yuan BZ, Miller MJ, Keck CL, Zimonjic DB, Thorgeirsson SS, et al. Cloning, characterization, and chromosomal localization of a gene frequently deleted in human liver cancer (DLC-1) homologous to rat RhoGAP. Cancer Res. 1998;58:2196–2199. - PubMed
    1. Wong CM, Yam JW, Ching YP, Yau TO, Leung TH, et al. Rho GTPase-activating protein deleted in liver cancer suppresses cell proliferation and invasion in hepatocellular carcinoma. Cancer Res. 2005;65:8861–8868. - PubMed
    1. Xue W, Krasnitz A, Lucito R, Sordella R, Vanaelst L, et al. DLC1 is a chromosome 8p tumor suppressor whose loss promotes hepatocellular carcinoma. Genes Dev. 2008;22:1439–1444. - PMC - PubMed

Publication types