

Semiautomated three-dimensional segmentation software to quantify carpal bone volume changes on wrist CT scans for arthritis assessment
- PMID: 18649465
- PMCID: PMC2673630
- DOI: 10.1118/1.2900111
Semiautomated three-dimensional segmentation software to quantify carpal bone volume changes on wrist CT scans for arthritis assessment
Abstract
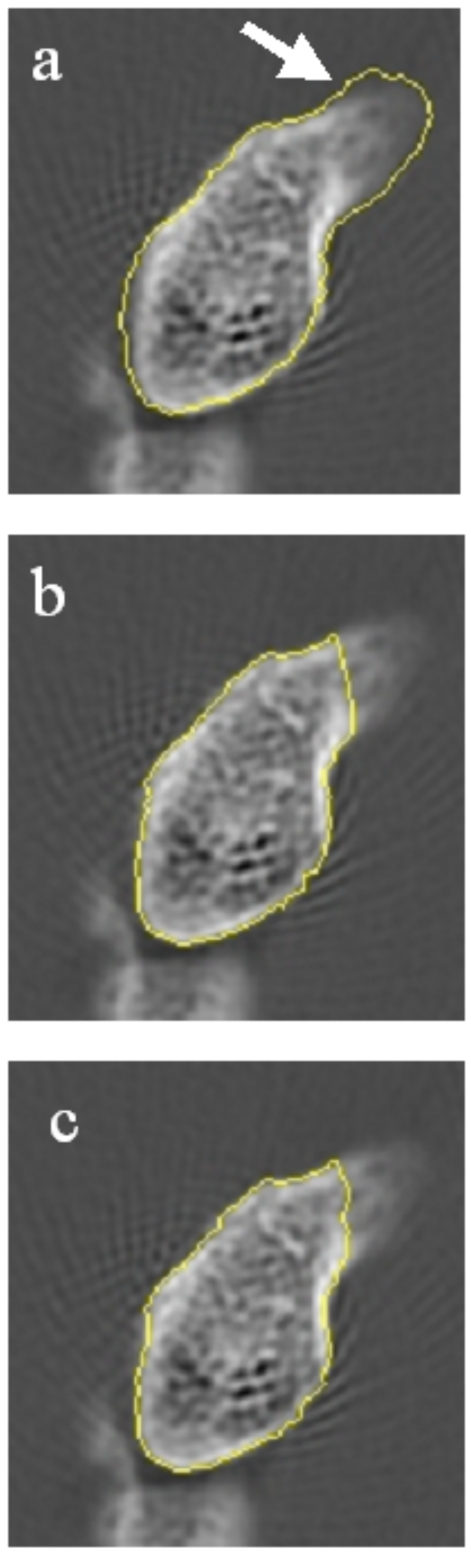
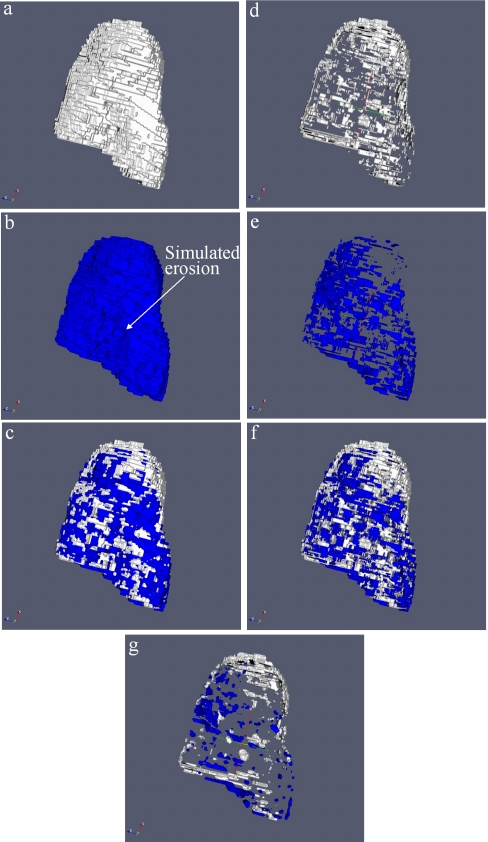
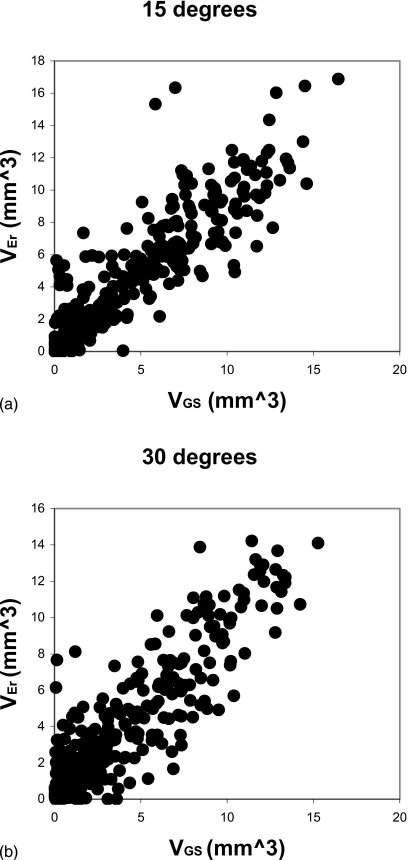
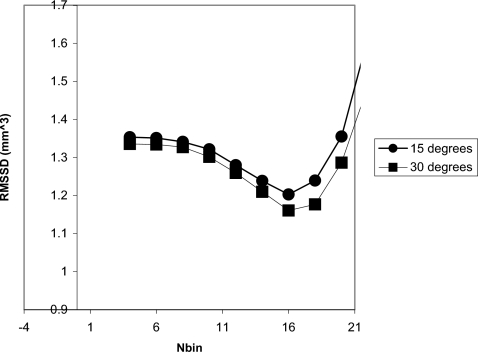
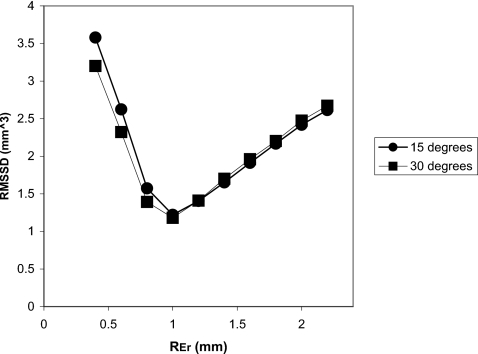
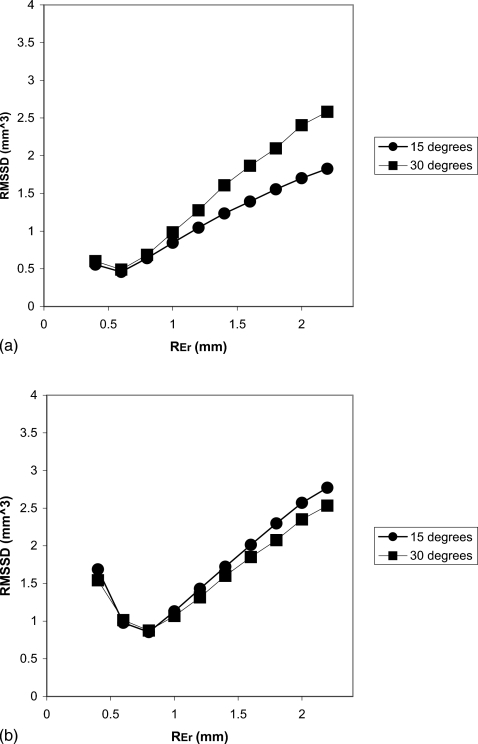
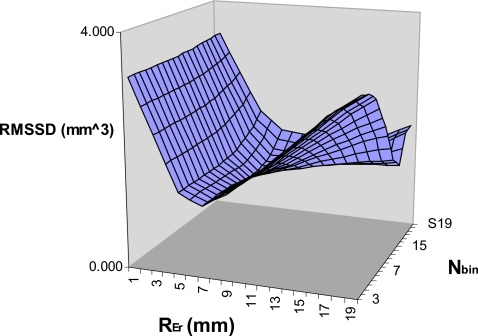
Rapid progression of joint destruction is an indication of poor prognosis in patients with rheumatoid arthritis. Computed tomography (CT) has the potential to serve as a gold standard for joint imaging since it provides high resolution three-dimensional (3D) images of bone structure. The authors have developed a method to quantify erosion volume changes on wrist CT scans. In this article they present a description and validation of the methodology using multiple scans of a hand phantom and five human subjects. An anthropomorphic hand phantom was imaged with a clinical CT scanner at three different orientations separated by a 30-deg angle. A reader used the semiautomated software tool to segment the individual carpal bones of each CT scan. Reproducibility was measured as the root-mean-square standard deviation (RMMSD) and coefficient of variation (CoV) between multiple measurements of the carpal volumes. Longitudinal erosion progression was studied by inserting simulated erosions in a paired second scan. The change in simulated erosion size was calculated by performing 3D image registration and measuring the volume difference between scans in a region adjacent to the simulated erosion. The RMSSD for the total carpal volumes was 21.0 mm3 (CoV = 1.3%) for the phantom, and 44.1 mm3 (CoV = 3.0%) for the in vivo subjects. Using 3D registration and local volume difference calculations, the RMMSD was 1.0-3.0 mm3 The reader time was approximately 5 min per carpal bone. There was excellent agreement between the measured and simulated erosion volumes. The effect of a poorly measured volume for a single erosion is mitigated by the large number of subjects that would comprise a clinical study and that there will be many erosions measured per patient. CT promises to be a quantifiable tool to measure erosion volumes and may serve as a gold standard that can be used in the validation of other modalities such as magnetic resonance imaging.
Figures
References
-
- Callahan L. F. and Yelin E. H., in Primer on the Rheumatic Diseases, edited by Klippel J. H. (Arthritis Foundation, Atlanta, 2001), pp. 1–4.
-
- Goronzy J. J. and Weyand C. M., in Primer on the Rheumatic Diseases, edited by Klippel J. H. (William M. Otto, Atlanta, 1997), pp. 155–161.
-
- Lawrence R. C., Helmick C. G., Arnett F. C., Deyo R. A., Felson D. T., Giannini E. H., Heyse S. P., Hirsch R., Hochberg M. C., Hunder G. G., Liang M. H., Pillemer S. R., Steen V. D., and Wolfe F., “Estimates of the prevalence of arthritis and selected musculoskeletal disorders in the United States,” Arthritis Rheum. 41, 778–799 (1998). - PubMed
-
- Yelin E. and Wanke L. A., “An assessment of the annual and long-term direct costs of rheumatoid arthritis: The impact of poor function and functional decline,” Arthritis Rheum. 42, 1209–1218 (1999). - PubMed
-
- Pincus T. and Callahan L. F., “Early mortality in RA predicted by poor clinical status,” Bull. Rheum. Dis. 41, 1–4 (1992). - PubMed
Publication types
MeSH terms
Grants and funding
LinkOut - more resources
Full Text Sources
Medical
