

Quantitative image quality evaluation of MR images using perceptual difference models
- PMID: 18649487
- PMCID: PMC2673629
- DOI: 10.1118/1.2903207
Quantitative image quality evaluation of MR images using perceptual difference models
Abstract
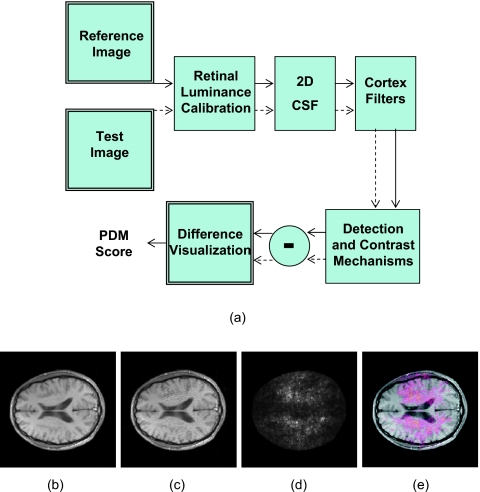
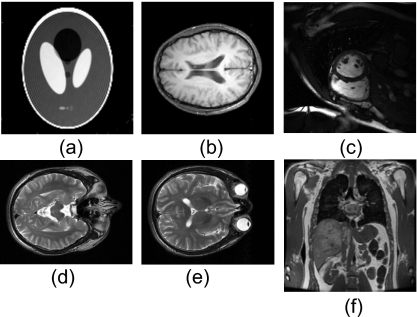
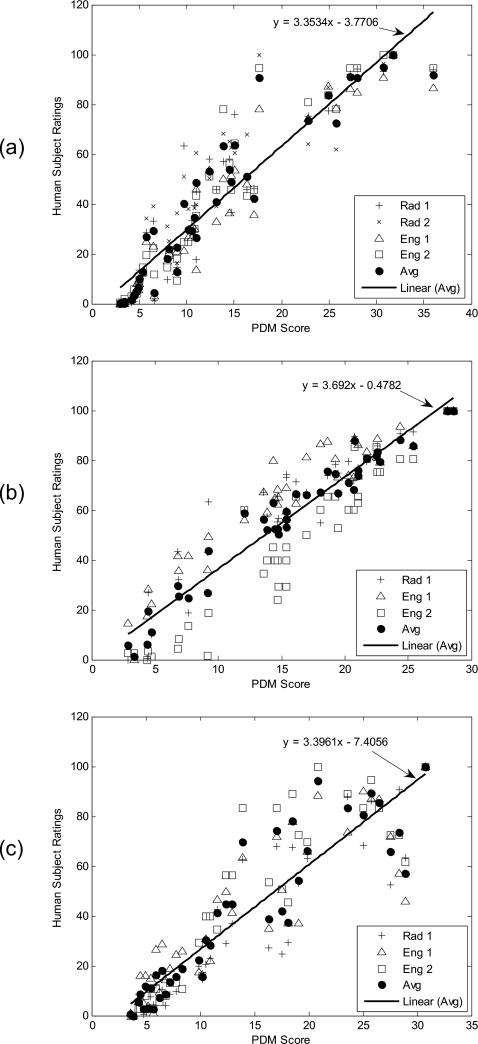
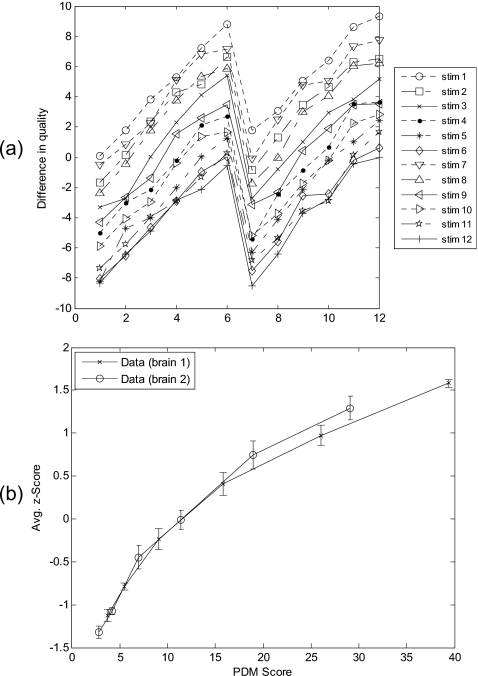
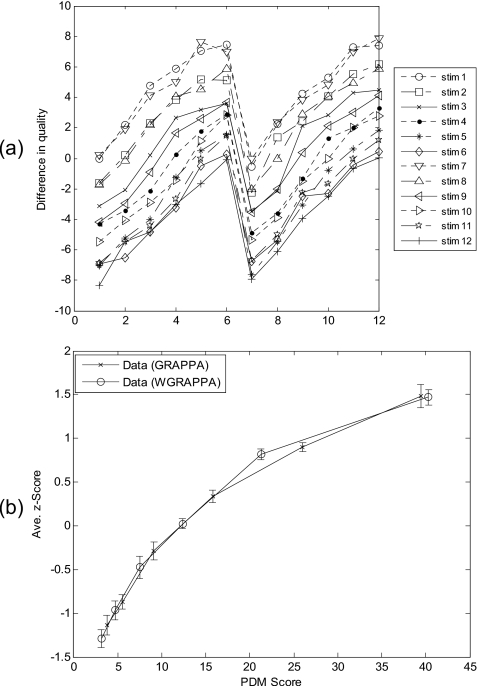
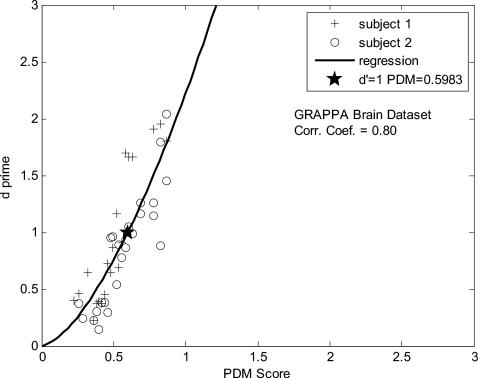
The authors are using a perceptual difference model (Case-PDM) to quantitatively evaluate image quality of the thousands of test images which can be created when optimizing fast magnetic resonance (MR) imaging strategies and reconstruction techniques. In this validation study, they compared human evaluation of MR images from multiple organs and from multiple image reconstruction algorithms to Case-PDM and similar models. The authors found that Case-PDM compared very favorably to human observers in double-stimulus continuous-quality scale and functional measurement theory studies over a large range of image quality. The Case-PDM threshold for nonperceptible differences in a 2-alternative forced choice study varied with the type of image under study, but was approximately 1.1 for diffuse image effects, providing a rule of thumb. Ordering the image quality evaluation models, we found in overall Case-PDM approximately IDM (Sarnoff Corporation) approximately SSIM [Wang et al. IEEE Trans. Image Process. 13, 600-612 (2004)] > mean squared error NR [Wang et al. (2004) (unpublished)] > DCTune (NASA) > IQM (MITRE Corporation). The authors conclude that Case-PDM is very useful in MR image evaluation but that one should probably restrict studies to similar images and similar processing, normally not a limitation in image reconstruction studies.
Figures
Similar articles
-
A new perceptual difference model for diagnostically relevant quantitative image quality evaluation: a preliminary study.Magn Reson Imaging. 2013 May;31(4):596-603. doi: 10.1016/j.mri.2012.09.009. Epub 2012 Dec 5. Magn Reson Imaging. 2013. PMID: 23218792 Free PMC article.
-
Methods for quantitative image quality evaluation of MRI parallel reconstructions: detection and perceptual difference model.Magn Reson Imaging. 2007 Jun;25(5):712-21. doi: 10.1016/j.mri.2006.10.019. Epub 2007 Feb 26. Magn Reson Imaging. 2007. PMID: 17540283
-
Application of perceptual difference model on regularization techniques of parallel MR imaging.Magn Reson Imaging. 2006 Feb;24(2):123-32. doi: 10.1016/j.mri.2005.10.018. Epub 2005 Dec 27. Magn Reson Imaging. 2006. PMID: 16455401
-
Diffusion-weighted MR of the brain: methodology and clinical application.Radiol Med. 2005 Mar;109(3):155-97. Radiol Med. 2005. PMID: 15775887 Review. English, Italian.
-
Real-time image reconstruction system for interventional magnetic resonance surgery.Technol Health Care. 1994 Dec;2(4):267-73. Technol Health Care. 1994. PMID: 7842311 Review.
Cited by
-
Super-resolution reconstruction in frequency, image, and wavelet domains to reduce through-plane partial voluming in MRI.Med Phys. 2015 Dec;42(12):6919-32. doi: 10.1118/1.4935149. Med Phys. 2015. PMID: 26632048 Free PMC article.
-
A simple application of compressed sensing to further accelerate partially parallel imaging.Magn Reson Imaging. 2013 Jan;31(1):75-85. doi: 10.1016/j.mri.2012.06.028. Epub 2012 Aug 15. Magn Reson Imaging. 2013. PMID: 22902065 Free PMC article.
-
Effect of radiation dose and adaptive statistical iterative reconstruction on image quality of pulmonary computed tomography.Jpn J Radiol. 2012 Feb;30(2):146-53. doi: 10.1007/s11604-011-0026-7. Epub 2011 Dec 17. Jpn J Radiol. 2012. PMID: 22180184
-
Agreement of Image Quality Metrics with Radiological Evaluation in the Presence of Motion Artifacts.ArXiv [Preprint]. 2025 May 23:arXiv:2412.18389v2. ArXiv. 2025. Update in: MAGMA. 2025 Jun 10. doi: 10.1007/s10334-025-01266-y. PMID: 39764402 Free PMC article. Updated. Preprint.
-
Agreement of image quality metrics with radiological evaluation in the presence of motion artifacts.MAGMA. 2025 Jun 10. doi: 10.1007/s10334-025-01266-y. Online ahead of print. MAGMA. 2025. PMID: 40493331
References
-
- Tsao J., Boesiger P., and Pruessmann K. P., “k−t BLAST and k−t SENSE: Dynamic MRI with high frame rate exploiting spatiotemporal correlations,” Magn. Reson. Med. 50, 1031–1042 (2003). - PubMed
-
- Breuer F. A., Kellman P., Griswold M. A., and Jakob P. M., “Dynamic autocalibrated parallel imaging using temporal GRAPPA (TGRAPPA),” Magn. Reson. Med. 53, 981–985 (2005). - PubMed
Publication types
MeSH terms
Grants and funding
LinkOut - more resources
Full Text Sources
Other Literature Sources
