. 2008 Oct;129(1):132-44.
doi: 10.1016/j.clim.2008.05.009. Epub 2008 Jul 22.

PDL-1 upregulation on monocytes and T cells by HIV via type I interferon: restricted expression of type I interferon receptor by CCR5-expressing leukocytes

Affiliations

PDL-1 upregulation on monocytes and T cells by HIV via type I interferon: restricted expression of type I interferon receptor by CCR5-expressing leukocytes

Adriano Boasso et al. Clin Immunol. 2008 Oct.

Abstract

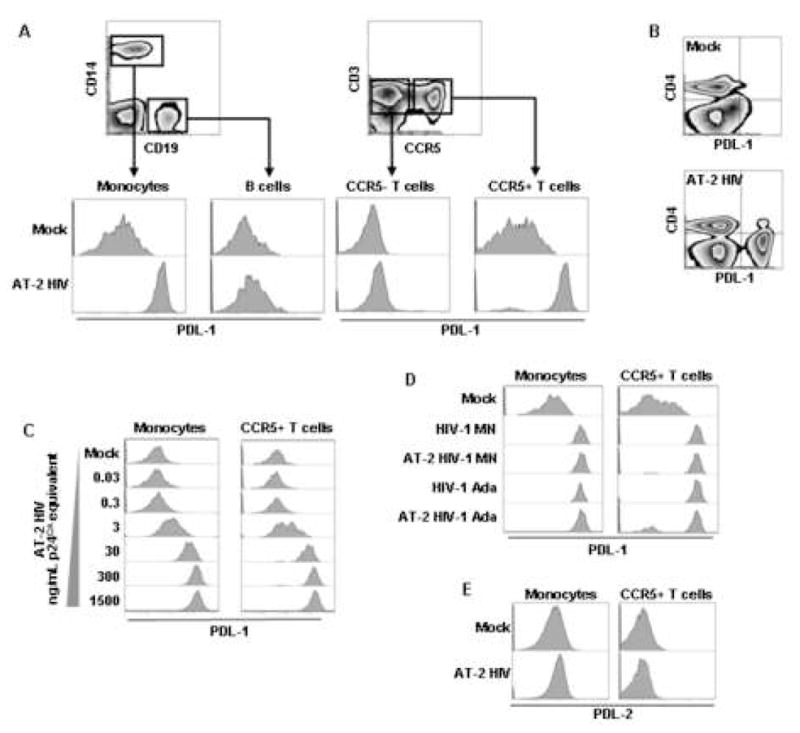
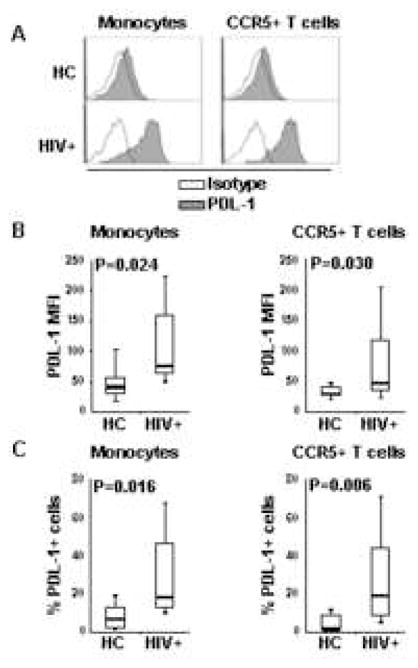
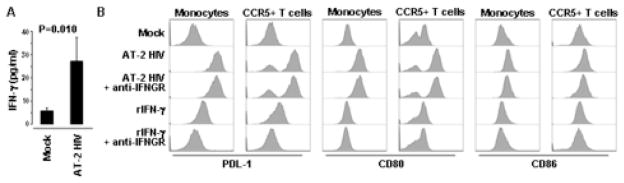
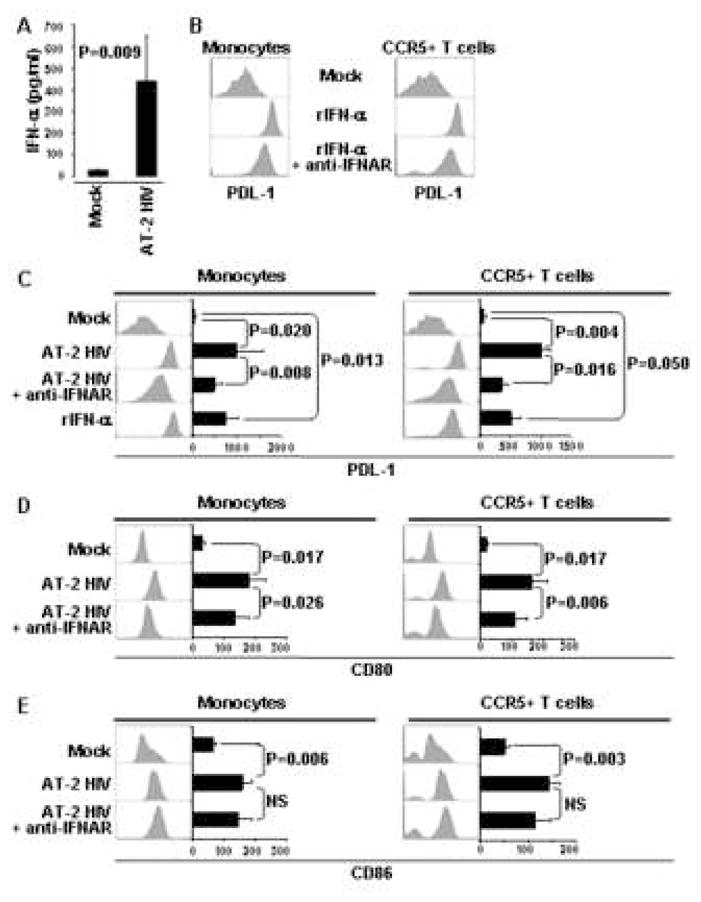
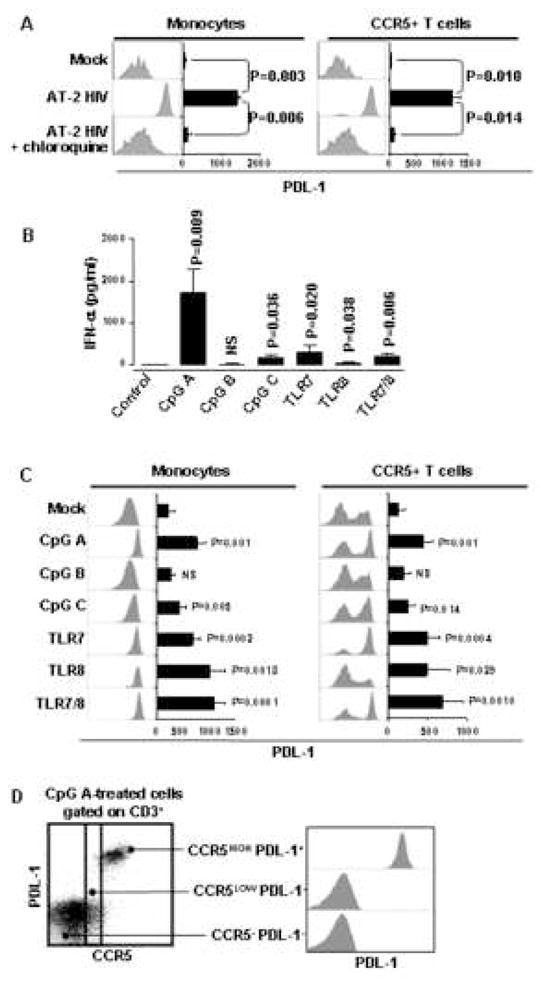
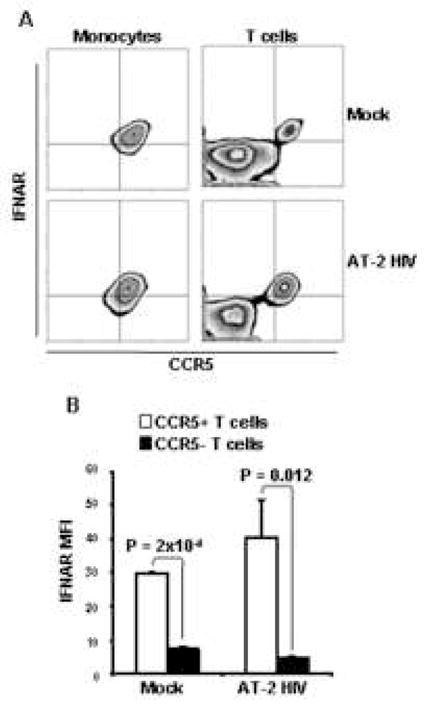
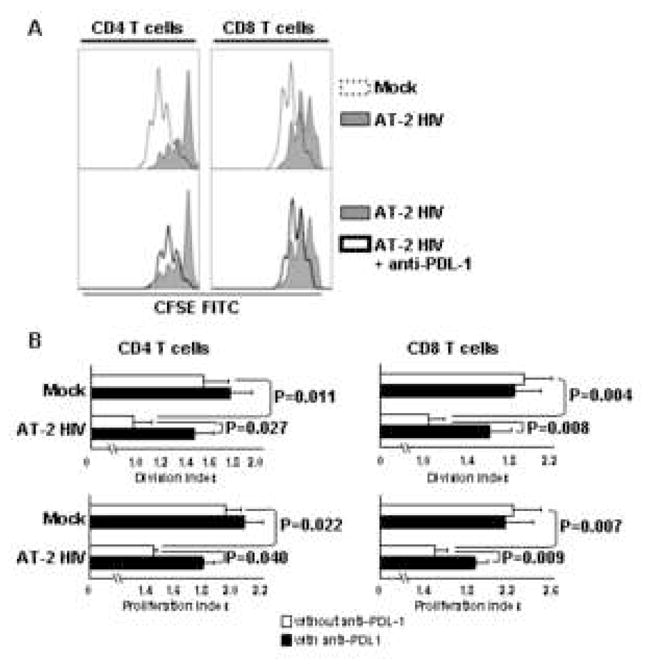
The programmed death (PD)-1 interacts with its ligand (PDL-1) delivering a negative signal to T cells. During human immunodeficiency virus (HIV)-1 infection PD-1 and PDL-1 expressions are increased. Here we show that monocytes and CCR5(+) T cells of HIV-uninfected donors upregulated PDL-1 upon in vitro exposure to HIV. HIV-induced PDL-1 required interferon (IFN)-alpha, but not IFN-gamma, production. Inhibition of endocytosis, required for HIV-induced IFN-alpha production, prevented PDL-1 upregulation. IFN-alpha-inducing Toll-like receptor (TLR) agonists increased PDL-1 on monocytes and CCR5(+) T cells. CD80 and CD86 were also increased on monocytes and CCR5(+) T cells after HIV exposure, but only CD80 was IFN-alpha-dependent. IFN-alpha-receptor subunit 2 (IFNAR2), was expressed only by CCR5(+) T cells and monocytes, explaining why these leukocytes responded to HIV-induced IFN-alpha. Finally, T cell proliferation was improved by PDL-1 blockade in HIV-treated PBMC. In the setting of HIV infection, IFN-alpha may negatively affect T cell responses by inducing PDL-1.


Figures

Figure 1
Figure 1. HIV induces PDL-1 expression on monocytes and CCR5+ T cells
(A) Flow cytometry contour plot showing gating on monocytes (CD14+ cells) and B cells (CD19+) (left upper panel), or CCR5+ and CCR5 T cells (CD3+ cells) (right upper panel); lower panels show flow cytometry histograms of PDL-1 expression in the gated subpopulations after 24 hours of culture of PBMC in presence of AT-2 HIVMN (experiments conducted using AT-2 HIVAda or non-AT-2-treated HIV-1MN or HIV-1Ada gave comparable results) or control microvescicles (Mock). (B) Flow cytometry contour plot showing simultaneous expression of CD4 and PDL-1 in PBMC after 24 hours of culture in presence of AT-2 HIV or control microvescicles (Mock). (C) Flow cytometry histograms of PDL-1 expression gated on monocytes (CD14+ cells) or CCR5+ T cells (CD3+ cells) after 24 hours of culture in presence of different concentrations of AT-2 HIV. (C) Flow cytometry histograms of PDL-1 expression gated on monocytes (CD14+ cells) or CCR5+ T cells (CD3+ cells) after 24 hours of culture in presence of AT-2 HIVMN AT-2 HIVAda or their infectious counterparts. (E) Flow cytometry histograms of PDL-2 expression gated on monocytes (CD14+ cells) or CCR5+ T cells (CD3+ cells) after 24 hours of culture of PBMC in presence of AT-2 HIV or control microvescicles (Mock). In all cases one example characteristic of at least five independent experiments is shown.
Figure 2
Figure 2. Increased PDL-1 on monocytes and CCR5+ T cells form HIV-infected parients
(A) Flow cytometry histograms of PDL-1 expression gated on monocytes (CD14+ cells) or CCR5+ T cells (CD3+ cells) from PBMC of one HIV-uninfected healthy control (HC) and one HIV-infected (HIV+); open lines represent the baseline fluorescence of staining with isotype antibody, solid lines represent fluorescence of staining with anti-PDL-1 antibody. (B) Box plots showing PDL-1 MFI in monocytes and CCR5+ T cells measured in 14 HIV+ and 8 HC. (C) Box plots showing frequency of PDL-1-expressing cells within monocytes and CCR5+ T cells measured in 14 HIV+ and 8 HC. In (B) and (C) horizontal bars represent median values; upper and lower limits of boxes are 75th and 25th percentiles; vertical lines extend to 90th and 10th percentiles.
Figure 3
Figure 3. IFN-γ-signaling is not required for AT-2 HIV-induced PDL-1, CD80 and CD86
(A) Detection of IFN-γ by ELISA in supernatants from PBMC cultured in presence of AT-2 HIV or control microvescicles (Mock). (B) Surface expression of PDL-1, CD80 and CD86 analyzed by flow cytometry, gating on monocytes (CD14+ cells) or CCR5+ T cells (CD3+ cells), in PBMC cultured for 24 hours in presence of control microvescicles (Mock), AT-2 HIV alone or in presence of blocking antibodies against the cellular receptor for IFN-γ (anti-IFNGR), as well as rIFN-γ alone or in presence of anti-IFNGR. Flow cytometry histograms for one example characteristic of four independent experiments are shown.
Figure 4
Figure 4. AT-2 HIV-induced PDL-1 and CD80, but not CD86, is IFN-α-dependent
Detection of IFN-α (A) by ELISA in supernatants from PBMC cultured in presence of AT-2 HIV or control microvescicles (Mock). (B) Surface expression of PDL-1 analyzed by flow cytometry, gating on monocytes (CD14+ cells) or CCR5+ T cells (CD3+ cells), in PBMC cultured for 24 hours with rIFN-α alone or in presence of blocking antibodies against the cellular receptor for IFN-α (anti-IFNAR). Surface expression of PDL-1 (C), CD80 (D) and CD86 (E) analyzed by flow cytometry, gating on monocytes (CD14+ cells) or CCR5+ T cells (CD3+ cells), in PBMC cultured for 24 hours in presence of control microvescicles (Mock), AT-2 HIV alone or in presence of blocking antibodies against the cellular receptor for IFN-α (anti-IFNAR), as well as rIFN-α. Flow cytometry histograms for one example experiment are shown beside bar graphs, which summarize mean fluorescence intensity (MFI) obtained for the same conditions in five independent experiments. Mean values ± standard error are shown in the bar graphs. P<0.05 was considered statistically significant; NS = not significant
Figure 5
Figure 5. AT-2 HIV-induced PDL-1 is endocytosis-dependent and can be mimicked by TLR agonists which induce IFN-α production
(A) Surface expression of PDL-1 analyzed by flow cytometry, gating on monocytes (CD14+ cells) or CCR5+ T cells (CD3+ cells), in PBMC cultured for 24 hours in presence of control microvescicles (Mock), AT-2 HIV alone or in presence of chloroquine. (B) Detection of IFN-α by ELISA in supernatants from PBMC cultured in presence or absence of different TLR agonists. (C) Surface expression of PDL-1 analyzed by flow cytometry, gating on monocytes (CD14+ cells) or CCR5+ T cells (CD3+ cells), in PBMC cultured for 24 hours in presence or absence of different TLR agonists. (D) Left panel: dot plot flow cytometry graph of one example experiment showing staining for PDL-1 and CCR5 on gated T cells (CD3+ cells) from PBMC cultured for 24 hours in presence of the TLR9 agonist class A CpG ODN; right panel: detail of PDL-1 expression shown by flow cytometry histograms in the three populations of T cells defined in the left panel according to different patterns of CCR5 expression. In (A) and (C) flow cytometry histograms for one example experiment are shown beside bar graphs, which summarize mean fluorescence intensity (MFI) obtained for the same conditions in five independent experiments. Mean values ± standard error are shown in the bar graphs in (A), (B), (C). All P values indicated in (B) and (C) refer to comparison with the control. P<0.05 was considered statistically significant; NS = not significant.
Figure 6
Figure 6. IFNAR2 expression is restricted to CCR5-expressing cells
A) Flow cytometry contour plots showing CCR5 and IFNAR2 expression on monocytes (CD14+ cells; left panels) and T cells (CD3+ cells; right panels) from PBMC exposed to mock (upper panels) or AT-2 HIV (lower panels). One example of three independent experiments is shown. B) Bar graphs showing MFI of IFNAR2 staining in CCR5+ CD3+ cells (open bars) and CCR5 CD3+ cells (solid bars) from PBMC exposed to mock or AT-2 HIV. Mean values ± standard error are shown.
Figure 7
Figure 7. AT-2 HIV-induced PDL-1 inhibits CD4 and CD8 T cell proliferation
PBMC from three different donors were cultured with AT-2 HIV or control microvescicles (Mock). After 24 hours, T cell proliferation was induced by addition of anti-CD3 Ab, in presence or absence of blocking antibodies against PDL-1 (anti-PDL-1). Dilution of the CFSE staining was analyzed by flow cytometry for CD4+ and CD8+ T cells (CD3+ cells). A) Upper panels: flow cytometry histograms showing proliferative responses of CD4 (left panel) and CD8 T cells (right panel) in PBMC pre-treated with AT-2 HIV (tinted line) or mock (dotted line). Lower panels: flow cytometry histograms showing proliferative responses of CD4 (left panel) and CD8 T cells (right panel) in PBMC pre-treated with AT-2 HIV and stimulated in presence (heavy line) or absence (tinted line) of anti-PDL-1. One representative of 3 independent experiment is shown. B) Bar graphs showing division index (number of cell divisions/total cell number) and proliferation index (number of cell divisions/number of divided cells) of CD4 (left panels) and CD8 T cells (right panels) pretreated with AT-2 HIV or mock and stimulated with anti-CD3 in presence (solid bars) or absence (open bars) of anti-PDL-1. Mean values ± standard error are shown.

References

    1. Greenwald RJ, Freeman GJ, Sharpe AH. The B7 family revisited. Annu Rev Immunol. 2005;23:515–48. - PubMed
    1. Lespagnard L, Mettens P, Urbain J, Moser M. Role of B7 costimulation in the induction of T and B cell responses by dendritic cells in vivo. Adv Exp Med Biol. 1997;417:529–33. - PubMed
    1. Dong H, Zhu G, Tamada K, Chen L. B7-H1, a third member of the B7 family, co-stimulates T-cell proliferation and interleukin-10 secretion. Nat Med. 1999;5:1365–9. - PubMed
    1. Dolan MJ, Clerici M, Blatt SP, Hendrix CW, Melcher GP, Boswell RN, Freeman TM, Ward W, Hensley R, Shearer GM. In vitro T cell function, delayed-type hypersensitivity skin testing, and CD4+ T cell subset phenotyping independently predict survival time in patients infected with human immunodeficiency virus. J Infect Dis. 1995;172:79–87. - PubMed
    1. Sharpe AH, Wherry EJ, Ahmed R, Freeman GJ. The function of programmed cell death 1 and its ligands in regulating autoimmunity and infection. Nat Immunol. 2007;8:239–45. - PubMed

Publication types

MeSH terms