. 2008 Oct;100(4):2217-24.
doi: 10.1152/jn.90411.2008. Epub 2008 Jul 23.

Recovery from monocular deprivation using binocular deprivation

Affiliations

Recovery from monocular deprivation using binocular deprivation

Brian S Blais et al. J Neurophysiol. 2008 Oct.

Abstract

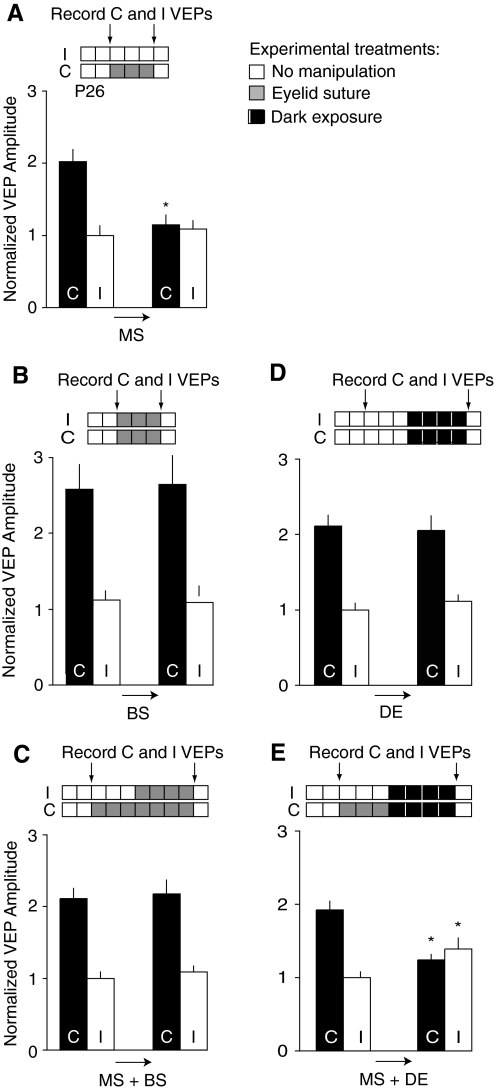
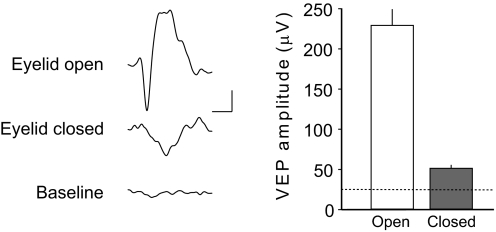
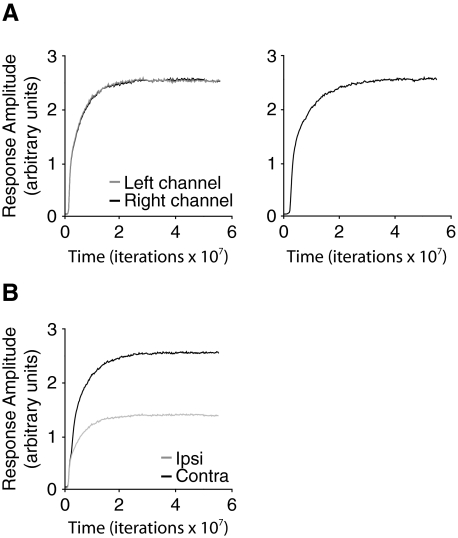
Ocular dominance (OD) plasticity is a robust paradigm for examining the functional consequences of synaptic plasticity. Previous experimental and theoretical results have shown that OD plasticity can be accounted for by known synaptic plasticity mechanisms, using the assumption that deprivation by lid suture eliminates spatial structure in the deprived channel. Here we show that in the mouse, recovery from monocular lid suture can be obtained by subsequent binocular lid suture but not by dark rearing. This poses a significant challenge to previous theoretical results. We therefore performed simulations with a natural input environment appropriate for mouse visual cortex. In contrast to previous work, we assume that lid suture causes degradation but not elimination of spatial structure, whereas dark rearing produces elimination of spatial structure. We present experimental evidence that supports this assumption, measuring responses through sutured lids in the mouse. The change in assumptions about the input environment is sufficient to account for new experimental observations, while still accounting for previous experimental results.


Figures

FIG. 1.
FIG. 1.
Model assumptions, natural images, and contralateral bias. Inputs that drive receptive field development as derived from natural images. A: an example of an original image. B: the resulting distribution of retinal ganglion cell and lateral geniculate nucleus (LGN) neuron activity, using parameters appropriate for modeling the mouse visual system. The filter used is a difference-of-Gaussians (DOG) with a center/surround radius ratio of 1–3. C: the rodent visual system has a strong contralateral bias. We use a simplified architecture to model the contralateral bias. Two pools of cells combine to give responses. Binocular cells (black) respond equally to contra and ipsilateral stimulation, whereas monocular cells (gray) respond only to contralateral stimulation. If the number of binocular cells is equal to the number of monocular cells, then the contra-to-ipsilateral response ratio (C/I) will be ∼2:1.
FIG. 2.
FIG. 2.
Monocular deprivation and recovery: experimental results. A: monocular lid suture (MS) for 3 days causes depression of the contralateral visually evoked potential (VEP; n = 8, contralateral VEP amplitude ± SE on day 0: 217 ± 18 μV; on day 3: 123 ± 15 μV; ipsilateral amplitude on day 0: 107 ± 14 μV; on day 3: 117 ± 12 μV, P < 0.05 paired t-test). B: binocular lid suture (BS) for 3 days does not alter the VEPs (n = 6, contralateral VEP amplitude ± SE on day 0: 222 ± 31 μV; on day 3: 227 ± 35 μV; ipsilateral amplitude on day 0: 87 ± 11 μV; on day 3: 92 ± 11 μV, data previously published by Frenkel and Bear 2004). C: MS for 3 days followed by 4 days of BS produces responses at day 7 that are indistinguishable from responses at the beginning of the trial (n = 5, contralateral VEP amplitude ± SE on day 0: 156 ± 10 μV; on day 7: 161 ± 14 μV; ipsilateral amplitude on day 0: 74 ± 6 μV; on day 7: 80 ± 7 μV). D: 4 days of placing the animals in the dark (DE) did not change the VEPs (n = 6, contralateral VEP amplitude ± SE on day 0: 148 ± 31 μV; on day 7: 144 ± 32 μV; ipsilateral amplitude on day 0: 70 ± 15 μV; on day 7: 78 ± 16 μV). E: 4 days of DE did not affect the shift caused by 3 days of MS (n = 10, contralateral VEP amplitude ± SE on day 0: 144 ± 9 μV; on day 7: 92 ± 6 μV; ipsilateral amplitude on day 0: 74 ± 6 μV; on day 7: 104 ± 11 μV). *P < 0.05 using paired t-test.
FIG. 3.
FIG. 3.
VEP responses elicited through shut eyes. VEPs were recorded in response to grating stimuli (0.05 cycles per degree) at 100% contrast while both eyes were open (open bar) and following binocular deprivation by lid suture (shaded bar). Baseline recordings were made in response to a gray screen of equal luminance (dashed line). VEPs were significantly greater than baseline when both eyes were open (post hoc paired t-test, P < 0.001) and when the eyelids were sutured closed (post hoc paired t-test, P < 0.001). Post hoc statistical comparisons were done after reaching significance with repeated measures 2-way ANOVA (P < 0.001).
FIG. 4.
FIG. 4.
Normal rearing in a mouse model. A: binocular (left) and monocular (right) cell responses vs. time. The y-axis represents the response of the trained neurons to test stimuli at the preferred orientation, measured in arbitrary units. As the model neuron is trained with natural images, the cell becomes selective, responding more strongly to oriented stimuli. B: combining the binocular and monocular responses, to mimic the VEP recordings, yields contralateral and ipsilateral responses that are used for all of the simulations. The binocular and monocular cell responses contribute equally to the contralateral responses, and the ipsilateral responses include only binocular responses from the ipsilateral channel. All responses are measured in arbitrary units. Contra-to-ipsi response ratio (C/I) is ∼2:1 the for normal mouse.
FIG. 5.
FIG. 5.
Simulations of monocular deprivation and recovery. A: the contralateral bias is reduced during simulations of MS, in which the deprived channel is modeled as degraded and noisy patterned input. B: BS (2 degraded channels) does not alter the contralateral bias or absolute responsiveness. C: BS after MS results in a recovery of the deprived eye responses. D: DE does not alter the contralateral bias or absolute responsiveness. E: DE after MS does not result in a recovery of deprived eye responses.
FIG. 6.
FIG. 6.
Spatial frequency and orientation tuning of simulated cells after recovery. A: the optimal spatial frequency is reduced after BS compared with normal cells. DE results in no change in optimal spatial frequency. B: orientation tuning is reduced in BS and unchanged in DE compared with normal cells.

References

    1. Bienenstock EL, Cooper LN, Munro PW. Theory for the development of neuron selectivity: orientation specificity and binocular interaction in visual cortex. J Neurosci 2: 32–48, 1982. - PMC - PubMed
    1. Blais BS, Intrator N, Shouval HZ, Cooper LN. Receptive field formation in natural scene environments. Comparison of single-cell learning rules. Neural Comput 10: 1797–1813, 1998. - PubMed
    1. Blais BS, Shouval HZ, Cooper LN. The role of presynaptic activity in monocular deprivation: comparison of homosynaptic and heterosynaptic mechanisms. Proc Natl Acad Sci USA 96: 1083–1087, 1999. - PMC - PubMed
    1. Blakemore C The conditions required for the maintenance of binocularity in the kitten's visual cortex. J Physiol 261: 423–444, 1976. - PMC - PubMed
    1. Drager UC, Olsen JF. Origins of crossed and uncrossed retinal projections in pigmented and albino mice. J Comp Neurol 191: 383–412, 1980. - PubMed

Publication types