. 2008 Jul 23;28(30):7679-86.
doi: 10.1523/JNEUROSCI.5640-07.2008.

The neuronal basis of attention: rate versus synchronization modulation

Affiliations

The neuronal basis of attention: rate versus synchronization modulation

Andres Buehlmann et al. J Neurosci. .

Abstract

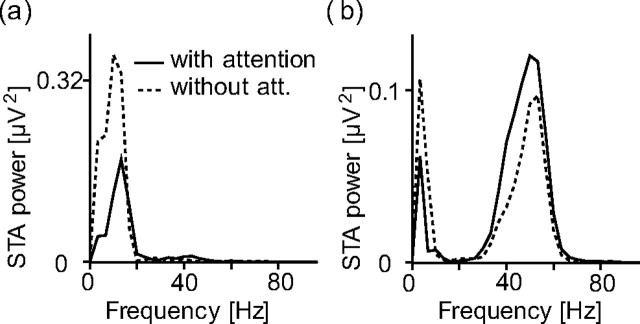
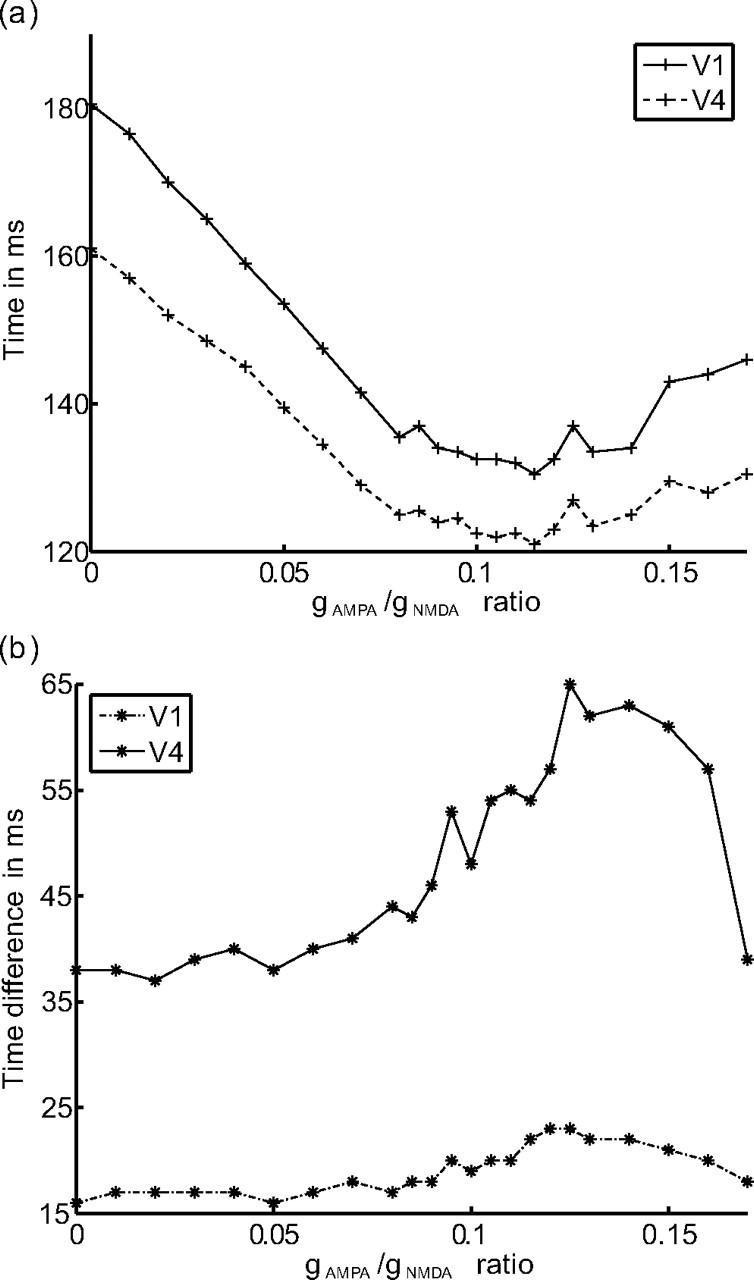
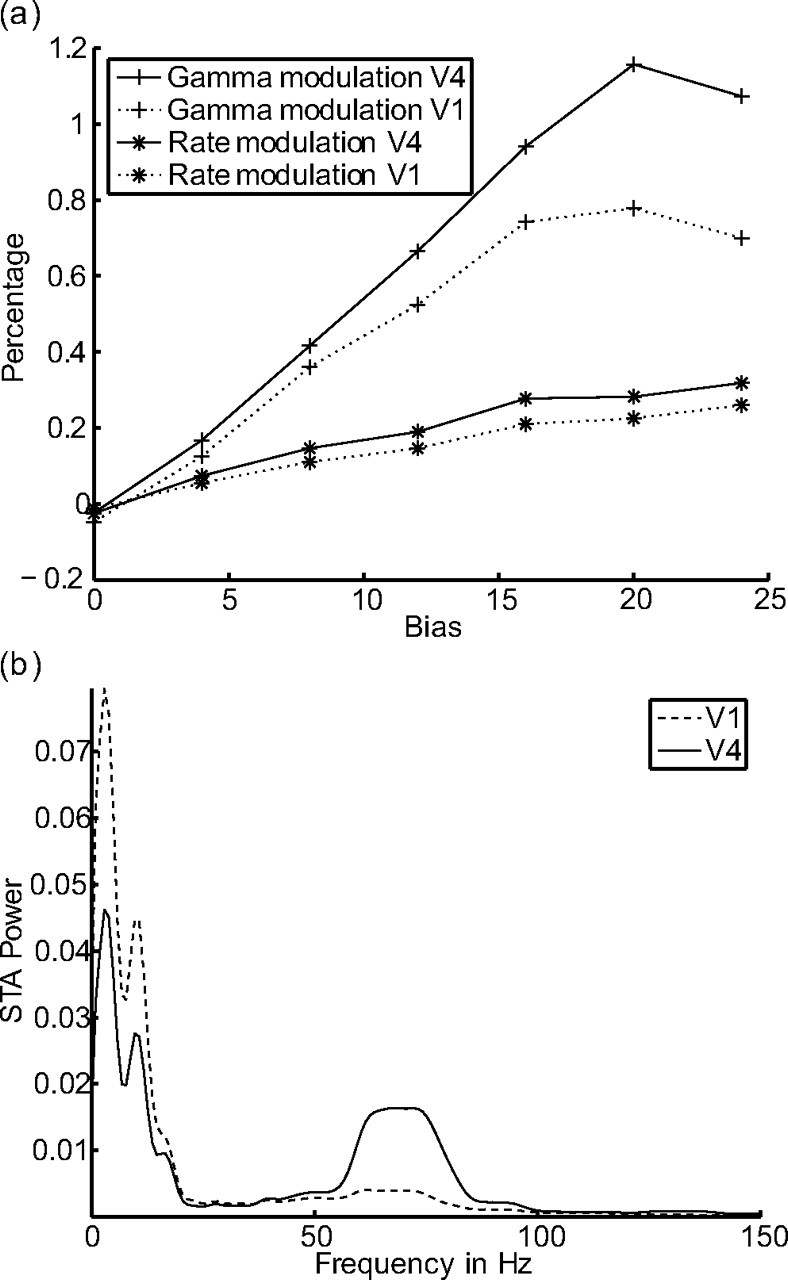
Extensive theoretical and experimental work on the neuronal correlates of visual attention raises two hypotheses about the underlying mechanisms. The first hypothesis, named biased competition, originates from experimental single-cell recordings that have shown that attention upmodulates the firing rates of the neurons encoding the attended features and downregulates the firing rates of the neurons encoding the unattended features. Furthermore, attentional modulation of firing rates increases along the visual pathway. The other, newer hypothesis assigns synchronization a crucial role in the attentional process. It stems from experiments that have shown that attention modulates gamma-frequency synchronization. In this paper, we study the coexistence of the two phenomena using a theoretical framework. We find that the two effects can vary independently of each other and across layers. Therefore, the two phenomena are not concomitant. However, we show that there is an advantage in the processing of information if rate modulation is accompanied by gamma modulation, namely that reaction times are shorter, implying behavioral relevance for gamma synchronization.


Figures

Figure 1.
Figure 1.
STA power spectra. Dashed curve, Attention outside the RF; solid curve, attention into the RF. Adapted from Fries et al. (2001). a, Power spectrum of the delay period STAs. The delay period was the 1 s interval before stimulus onset. b, Power spectrum of the stimulus-period STAs. The stimulus period lasted from 300 ms after stimulus onset until one of the stimuli changed its color.
Figure 2.
Figure 2.
Schematic representation of the network. The network consists of inhibitory and excitatory neurons. The excitatory neurons are organized in three pools per layer: the nonspecific neurons and the two selective pools (S1, S2 or S1′, S2′) that receive the input encoding the stimulus vin. One of the two selective pools gets an additional bias vbias. All neurons in the network get an input vext that simulates the spontaneous activity in the cerebral cortex. The selective pools of the two layers are connected. There are strong (Jf) and weak (Kf) feedforward connections and strong (Jb) and weak (Kb) feedback connections. Recurrent connections are denoted as w+, and between-pool connections are denoted as w. wI, w′I are the connection weights from the inhibitory to the excitatory pools, and wn, w′n are the connection weights from the nonspecific to the selective pools.
Figure 3.
Figure 3.
Raster plot of 40 neurons from the selective pools in V1. Stimulus onset is at 1000 ms and stimulus offset at 2000 ms. a–d, Neurons in the oscillatory regimen (gAMPA/gNMDA ratio of 0.12). a, Average rate with attention. b, Spikes with attention. c, Average rate without attention. d, Spikes without attention. e–h, Neurons outside the oscillatory regimen (gAMPA/gNMDA ratio of 0.0).
Figure 4.
Figure 4.
Changes in the STA power spectrum depending on the gAMPA/gNMDA ratio. For a selection of gAMPA/gNMDA ratios (indicated in the figure legend), we plot the power spectrum of the corresponding STAs. Averaged over 20 trials.
Figure 5.
Figure 5.
Power in the low-frequency (0–20 Hz) and gamma-frequency (35–65 Hz) band of the STA depending on the gAMPA/gNMDA ratio. For each value of the gAMPA/gNMDA ratio, we plot the percentage of power in the low-frequency band (dashed curve) and in the gamma-frequency band (solid curve). The error bars indicate the 95% confidence intervals. Averaged over 20 trials.
Figure 6.
Figure 6.
Example power spectrum of an STA comparing stimulus and delay (spontaneous) period. The power spectrum of an STA is plotted for the stimulus period (solid curve) and the delay period (dashed curve). Averaged over five trials.
Figure 7.
Figure 7.
Dependences of attentional modulation on inhibition and bias. Gamma power (dotted curve) shows how much of the power of the spectrum is in the gamma band. Rate modulation (solid curve) and gamma modulation (dashed curve) show the difference between attended and unattended pools in percentage. Averaged over 200 trials. a, Gamma power, rate modulation, and gamma modulation as a function of bias. For increasing bias, synchronization, rate modulation, and gamma modulation increase. b, Gamma power, rate modulation, and gamma modulation as a function of inhibition. For increasing inhibition, synchronization decreases, whereas both rate modulation and gamma modulation increase.
Figure 8.
Figure 8.
Rate modulation (solid) and gamma modulation (dashed) as a function of the gAMPA/gNMDA ratio. The main effect of increasing the gAMPA/gNMDA ratio is an increase in the network synchronization in the gamma band (dotted). The rate modulation decreases monotonically with the gAMPA/gNMDA ratio. The gamma modulation increases until a gAMPA/gNMDA ratio of ∼0.12 and then decreases to almost 0. The figure shows that either of the two types of attentional modulation can be predominant. Averaged over 200 trials.
Figure 9.
Figure 9.
Reaction times. a, Average time to reach the mean activity level after stimulus presentation in the selective pools. A higher gAMPA/gNMDA ratio makes the rates rise faster. The mean activity level is reached fastest for a gAMPA/gNMDA ratio between 0.10 and 0.13. In this range, also the attentional gamma modulation is maximal. b, Time difference in reaching the mean activity level after stimulus presentation between the pools encoding the attended and the unattended stimulus. This difference is biggest for a gAMPA/gNMDA ratio ∼0.12, which is also the range in which attentional gamma modulation is maximal.
Figure 10.
Figure 10.
Comparison of attentional modulation in two layers. a, Differences in attentional modulation between the two layers V1 and V4. The gamma modulation in the upper layer is up to 50% stronger than in the lower layer. The rate modulation in V4 is up to 28% stronger than in V1. In general, modulations in V4 are stronger than modulations in V1. b, Different gAMPA/gNMDA ratio in the two layers. The gAMPA/gNMDA ratio in layer V1 is 0.0 and in layer V4 is 0.15. Layer V4 clearly synchronizes in the gamma-frequency band, whereas V1 does not.

References

    1. Abeles M. Role of the cortical neuron-integrator or coincidence detector. Israel J Med Sci. 1982;18:83–92. - PubMed
    1. Brunel N, Wang XJ. Effects of neuromodulation in a cortical network model of object working memory dominated by recurrent inhibition. J Comput Neurosci. 2001;11:63–85. - PubMed
    1. Brunel N, Wang XJ. What determines the frequency of fast network oscillations with irregular neural discharges? I. Synaptic dynamics and excitation-inhibition balance. J Neurophysiol. 2003;90:415–430. - PubMed
    1. Chelazzi L. Serial attention mechanisms in visual search: a critical look at the evidence. Psychol Res. 1999;62:195–219. - PubMed
    1. Chelazzi L, Miller EK, Duncan J, Desimone R. A neural basis for visual-search in inferior temporal cortex. Nature. 1993;363:345–347. - PubMed

Publication types

MeSH terms

Substances