. 2008 Nov;57(11):3056-68.
doi: 10.2337/db08-0393. Epub 2008 Jul 23.

Lessons from the first comprehensive molecular characterization of cell cycle control in rodent insulinoma cell lines

Affiliations

Lessons from the first comprehensive molecular characterization of cell cycle control in rodent insulinoma cell lines

Irene Cozar-Castellano et al. Diabetes. 2008 Nov.

Abstract

Objective: Rodent insulinoma cell lines may serve as a model for designing continuously replicating human beta-cell lines and provide clues as to the central cell cycle regulatory molecules in the beta-cell.

Research design and methods: We performed a comprehensive G1/S proteome analysis on the four most widely studied rodent insulinoma cell lines and defined their flow cytometric profiles and growth characteristics.

Results: 1) Despite their common T-antigen-derived origins, MIN6 and BTC3 cells display markedly different G1/S expression profiles; 2) despite their common radiation origins, RINm5F and INS1 cells display striking differences in cell cycle protein profiles; 3) phosphorylation of pRb is absent in INS1 and RINm5F cells; 4) cyclin D2 is absent in RINm5F and BTC3 cells and therefore apparently dispensable for their proliferation; 5) every cell cycle inhibitor is upregulated, presumably in a futile attempt to halt proliferation; 6) among the G1/S proteome members, seven are pro-proliferation molecules: cyclin-dependent kinase-1, -2, -4, and -6 and cyclins A, E, and D3; and 7) overexpression of the combination of these seven converts arrested proliferation rates in primary rat beta-cells to those in insulinoma cells. Unfortunately, this therapeutic overexpression appears to mildly attenuate beta-cell differentiation and function.

Conclusions: These studies underscore the importance of characterizing the cell cycle at the protein level in rodent insulinoma cell lines. They also emphasize the hazards of interpreting data from rodent insulinoma cell lines as modeling normal cell cycle progression. Most importantly, they provide seven candidate targets for inducing proliferation in human beta-cells.


Figures
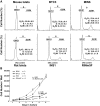
FIG. 1.
FIG. 1.
Proliferation rates for the four rodent insulinoma cell lines. A: Flow cytometric analysis of cell cycle distribution. Results (mean ± SE) display the percentage of cells in each phase of the cell cycle. Each figure is representative of five experiments. B: Growth curves for the four cell lines. Bars indicate SE. On day 0, 10,000 cells were plated. Each line represents three separate experiments performed in triplicate (n = 9).
FIG. 2.
FIG. 2.
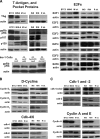
The G1/S proteome of the four rodent insulinoma cell lines. MIN6 and BTC3 cell lines are compared with mouse islets (M isl). INS1 (INS) and RIN (RINm5F) lines are compared with rat islets (R isl). Actin blots are representative and demonstrate even loading. A: Western-blot analysis of T-Ag, pocket proteins, and the E2F transcription factor family. The bottom left panel shows induction of pRb phosphorylation in INS1 cells that have been transduced with the combination of the adenoviruses Ad.cdk4 plus Ad.cyclin D1. B: The cyclin D1, D2, and D3 and cdk-4 and -6 family. C: The cdk-1/cdc2 and cdk-2 and cyclin A and E family. D: The INK4 family, the CIP/KIP family, and the tumor suppressor, menin. E: The tumor suppressor, p53, its regulatory protein MDM2, and the Id family. Each blot represents three to five immunoblots.
FIG. 2.
FIG. 2.
The G1/S proteome of the four rodent insulinoma cell lines. MIN6 and BTC3 cell lines are compared with mouse islets (M isl). INS1 (INS) and RIN (RINm5F) lines are compared with rat islets (R isl). Actin blots are representative and demonstrate even loading. A: Western-blot analysis of T-Ag, pocket proteins, and the E2F transcription factor family. The bottom left panel shows induction of pRb phosphorylation in INS1 cells that have been transduced with the combination of the adenoviruses Ad.cdk4 plus Ad.cyclin D1. B: The cyclin D1, D2, and D3 and cdk-4 and -6 family. C: The cdk-1/cdc2 and cdk-2 and cyclin A and E family. D: The INK4 family, the CIP/KIP family, and the tumor suppressor, menin. E: The tumor suppressor, p53, its regulatory protein MDM2, and the Id family. Each blot represents three to five immunoblots.
FIG. 3.
FIG. 3.
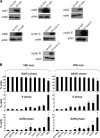
The effect of cell cycle phase on the seven key pro-cell cycle molecules in INS1 cells. A: FACS histogram of INS1 cells grown under randomly cycling nonsynchronized (Non-Sync) conditions, under conditions of growth arrest (Arrested) induced by exposure to 2.8 mmol/l glucose and serum withdrawal for 96 h, and after release from arrest (Released) by the addition of complete medium (see research design and methods) for 24 h. B: Representative immunoblots of the seven key G1/S molecules under each of these three conditions, compared with extracts of rat islets. As can be seen, whereas some changes do occur in the G1/S molecules with growth arrest, they are minor compared with their marked overexpression compared with rat islets.
FIG. 4.
FIG. 4.
The effect of glucose on key cell cycle proteins in rat islets and INS1 cells. A: Cell cycle distribution of rat islet cells and INS1 cells at 5.5 and 11 mmol/l glucose. B: The effect of glucose on the expression of the seven candidate cell cycle activators plus cyclins D1 and D2. 5.5 and 11 refer to 5.5 and 11 mmol/l glucose concentrations. Each experiment was performed three times.
FIG. 5.
FIG. 5.
Consequences of cyclin-cdk overexpression in rat islets. A: Documentation of overexpression of the seven candidate cell cycle activators. B: The effect of individual overexpression of the seven cell cycle activators at 100 MOI (left) or 700 MOI (right) on rat islet cell proliferation as measured by flow cytometry. *P < 0.05. Each experiment was performed three times. C: Flow cytometric analysis of the effect of combined overexpression of the seven cell cycle activators on rat islet cell proliferation. Each condition used a maximum of 700 MOI, with 100 MOI of each virus shown on the x-axis. *P < 0.05 vs. Ad.GFP; #P < 0.05 compared with INS1 cells. Each experiment was performed three to five times. D: The effect of three different adenovirus MOI on rat islet cell proliferation. The numbers of MOI used for these experiments were 250, 500, and 700 MOI. Each bar represents four experiments.
FIG. 5.
FIG. 5.
Consequences of cyclin-cdk overexpression in rat islets. A: Documentation of overexpression of the seven candidate cell cycle activators. B: The effect of individual overexpression of the seven cell cycle activators at 100 MOI (left) or 700 MOI (right) on rat islet cell proliferation as measured by flow cytometry. *P < 0.05. Each experiment was performed three times. C: Flow cytometric analysis of the effect of combined overexpression of the seven cell cycle activators on rat islet cell proliferation. Each condition used a maximum of 700 MOI, with 100 MOI of each virus shown on the x-axis. *P < 0.05 vs. Ad.GFP; #P < 0.05 compared with INS1 cells. Each experiment was performed three to five times. D: The effect of three different adenovirus MOI on rat islet cell proliferation. The numbers of MOI used for these experiments were 250, 500, and 700 MOI. Each bar represents four experiments.
FIG. 6.
FIG. 6.
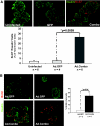
The effect of combined overexpression of the seven cell cycle activators on rat β-cell proliferation. β-Cell proliferation was measured by double staining for Ki-67 and insulin (A) or BrdU and insulin (B). Representative examples are shown in the top panels and quantitation in the bottom panel and represented by percentage of double positives Ki-67/insulin or BrdU/insulin. n indicates the number of experiments performed. (Please see http://dx.doi.org/10.2337/db08-0393 for a high-quality digital representation of this figure.)
FIG. 7.
FIG. 7.
The effect of combined overexpression of the seven cell cycle activators on rat β-cell death. β-Cell apoptosis was measured by double staining of TUNEL and insulin and represented by percentage of double positives for TUNEL/insulin. The conditions were the same as in Fig. 4C, and fixation was performed 72 h after transduction. n indicates number of experiments performed. (Please see http://dx.doi.org/10.2337/db08-0393 for a high-quality digital representation of this figure.)
FIG. 8.
FIG. 8.
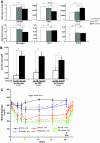
The effect of combined overexpression of the seven cell cycle activators on rat islet cell differentiation markers, GSIS, and islet transplantation. A: Quantitative PCR was performed on the RNA of five to six different preparations of isolated rat islets transduced with virus as indicated. B: GSIS in uninfected and Ad.GFP- and Ad.combo-transduced islets exposed to 2.0 and 22 mmol/l glucose concentrations. n indicates the number of experiments performed, and each experiment was performed by triplicate. *P < 0.05. C: Transplantation of rat islets into streptozotocin-induced diabetic NOD-SCID mice. Fifty, 100, or 200 IEs of normal nontransduced/islets or Ad.GFP-transduced islets served as controls (CTL) and were compared with Ad.Combo-transduced (Combo). Islets were transplanted under the mouse kidney capsule. Uninephrectomy (UNX) was performed 28 days after the transplant. “Sham” indicates the blood glucose in mice that had identical surgery but did not receive islets.

References

    1. Cozar-Castellano I, Fiaschi-Taesch N, Bigatel TA, Takane KK, Garcia-Ocana A, Vasavada RC, Stewart AF: Molecular control of cell cycle progression in the pancreatic beta cell. Endocrine Reviews 27: 356–370, 2006 - PubMed
    1. Heit JJ, Karnik SK, Kim SK: Intrinsic regulators of pancreatic beta-cell proliferation. Annu Rev Cell Dev Biol 22: 311–338, 2006 - PubMed
    1. Hohmeier H, Newgard CB: Cell lines derived from pancreatic islets. Mol Cell Endocrinol 228: 121–128, 2004 - PubMed
    1. Gazdar AF, Chick WL, Oie HK, Sims HL, King DL, Weir GC, Lauris V: Continuous, clonal, insulin- and somatostatin-secreting cell lines established from transplantable rat islet cell tumor. Proc Natl Acad Sci U S A 77: 3519–3523, 1980 - PMC - PubMed
    1. Asfari M, Janjic D, Meda P, Li G, Halban PA, Wollheim CB: Establishment of 2-mercaptoethanol-dependent differentiated insulin-secreting cell lines. Endocrinology 130: 167–178, 1992 - PubMed

Publication types

MeSH terms