

Glucose and C-peptide changes in the perionset period of type 1 diabetes in the Diabetes Prevention Trial-Type 1
- PMID: 18650369
- PMCID: PMC2571043
- DOI: 10.2337/dc08-0935
Glucose and C-peptide changes in the perionset period of type 1 diabetes in the Diabetes Prevention Trial-Type 1
Abstract
Objective: We examined metabolic changes in the period immediately after the diagnosis of type 1 diabetes and in the period leading up to its diagnosis in Diabetes Prevention Trial-Type 1 (DPT-1) participants.
Research design and methods: The study included oral insulin trial participants and parenteral insulin trial control subjects (n = 63) in whom diabetes was diagnosed by a 2-h diabetic oral glucose tolerance test (OGTT) that was confirmed by another diabetic OGTT within 3 months. Differences in glucose and C-peptide levels between the OGTTs were assessed.
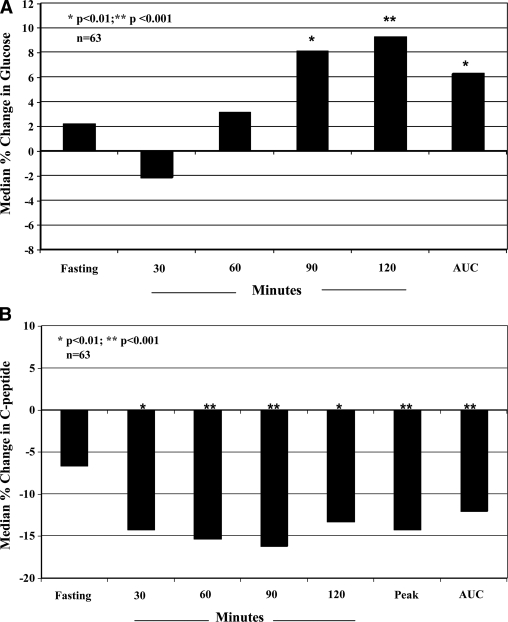
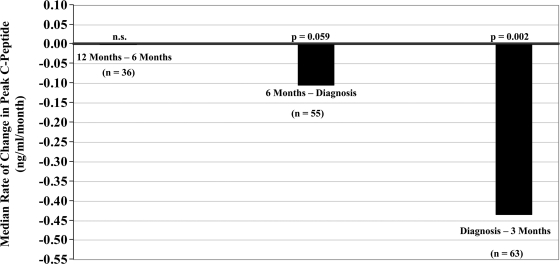
Results: Glucose levels increased at 90 (P = 0.006) and 120 min (P < 0.001) from the initial diabetic OGTT to the confirmatory diabetic OGTT (mean +/- SD interval 5.5 +/- 2.8 weeks). Peak C-peptide levels fell substantially between the OGTTs (median change -14.3%, P < 0.001). Among the 55 individuals whose last nondiabetic OGTT was approximately 6 months before the initial diabetic OGTT, peak C-peptide levels decreased between these two OGTTs (median change -14.0%, P = 0.052). Among those same individuals the median change in peak C-peptide levels from the last normal OGTT to the confirmatory OGTT (interval 7.5 +/- 1.3 months) was -23.8% (P < 0.001). Median rates of change in peak C-peptide levels were 0.00 ng x ml(-1) x month(-1) (P = 0.468, n = 36) from approximately 12 to 6 months before diagnosis, -0.10 ng x ml(-1) x month(-1) (P = 0.059, n = 55) from 6 months before diagnosis to diagnosis, and -0.43 ng x ml(-1) x month(-1) (P = 0.002, n = 63) from the initial diabetic OGTT to the confirmatory diabetic OGTT.
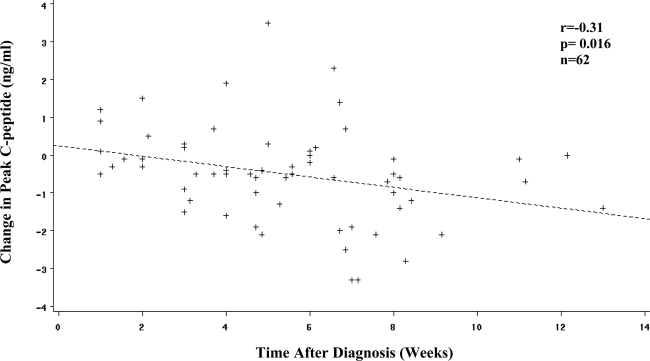
Conclusions: It seems that postchallenge C-peptide levels begin to decrease appreciably in the 6 months before diagnosis and decrease even more rapidly within 3 months after diagnosis.
Figures
References
-
- Greenbaum CJ, Cuthbertson D, Krischer JP, the Diabetes Prevention Trial of Type 1 Diabetes Study Group: Type 1 diabetes manifested solely by 2-h oral glucose tolerance test criteria. Diabetes 50:470–476, 2001 - PubMed
-
- Schatz D, Cuthbertson D, Atkinson M, Salzler MC, Winter W, Muir A, Silverstein J, Cook R, Maclaren N, She J, Greenbaum C, Krischer J: Preservation of C-peptide secretion in subjects at high risk of developing type 1 diabetes mellitus—a new surrogate measure of non-progression? Pediatr Diabetes 5:72–79, 2004 - PubMed
-
- Sosenko J, Palmer JP, Greenbaum CJ, Mahon J, Cowie C, Krischer JP, Chase HP, White NH, Buckingham B, Herold KC, Cuthbertson D, Skyler JS, the Diabetes Prevention Trial–Type 1 Study Group: Increasing the accuracy of oral glucose tolerance testing and extending its application to individuals with normal glucose tolerance for the prediction of type 1 diabetes. Diabetes Care 30:38–42, 2007 - PubMed
-
- Sosenko J, Palmer JP, Greenbaum CJ, Mahon J, Cowie C, Krischer JP, Chase HP, White NH, Buckingham B, Herold KC, Cuthbertson D, Skyler JS, the Diabetes Prevention Trial–Type 1 Study Group. Patterns of metabolic progression to type 1 diabetes in the diabetes prevention trial-type 1. Diabetes Care 29:643–649, 2006 - PubMed
-
- Snorgaard O, Lassen LH, Binder C: Homogeneity in pattern of decline of β-cell function in IDDM: prospective study of 204 consecutive cases followed for 7.4 yr. Diabetes Care 15:1009–1013, 1992 - PubMed
MeSH terms
Substances
Grants and funding
LinkOut - more resources
Full Text Sources
Other Literature Sources
Medical
