. 2008 Jul 29;105(30):10495-500.
doi: 10.1073/pnas.0802423105. Epub 2008 Jul 23.

Triggering receptor expressed on myeloid cell-like transcript 2 (TLT-2) is a counter-receptor for B7-H3 and enhances T cell responses

Affiliations

Triggering receptor expressed on myeloid cell-like transcript 2 (TLT-2) is a counter-receptor for B7-H3 and enhances T cell responses

Masaaki Hashiguchi et al. Proc Natl Acad Sci U S A. .

Erratum in

  • Proc Natl Acad Sci U S A. 2008 Sep 23;105(38):14744

Abstract

The B7 family member B7-H3 (CD276) plays important roles in immune responses. However, the function of B7-H3 remains controversial. We found that murine B7-H3 specifically bound to Triggering receptor expressed on myeloid cells (TREM)-like transcript 2 (TLT-2, TREML2). TLT-2 was expressed on CD8(+) T cells constitutively and on activated CD4(+) T cells. Stimulation with B7-H3 transfectants preferentially up-regulated the proliferation and IFN-gamma production of CD8(+) T cells. Transduction of TLT-2 into T cells resulted in enhanced IL-2 and IFN-gamma production via interactions with B7-H3. Blockade of the B7-H3:TLT-2 pathway with a mAb against B7-H3 or TLT-2 efficiently inhibited contact hypersensitivity responses. Our results demonstrate a direct interaction between B7-H3 and TLT-2 that preferentially enhances CD8(+) T cell activation.


Conflict of interest statement

The authors declare no conflict of interest.

Figures

Fig. 1.
Fig. 1.
B7-H3Ig specifically binds to cell surface TLT-2. (A) Staining of B7-H3Ig, B7–1Ig, B7-DCIg, and control human IgG1 to J558L cells transduced with pMXs-IG (vector control), TLT-2, TLT-4, TLT-6, CD300A, CD300D, CD28, CTLA-4, ICOS, PD-1, or BTLA. The values in the upper-right corners indicate the MFI of staining for the respective fusion protein, with gating on the GFP+ cells. (B) Scatchard plot analysis of B7-H3Ig binding to cell surface TLT-2. TLT-2/DO11.10 cells were stained with graded doses of biotinylated B7-H3Ig, followed by streptavidin-PE. B7-H1Ig was used as the control. (C) Binding inhibition by the anti-B7-H3 mAb or anti-TLT-2 mAb. (Upper) biotinylated B7-H3Ig (1 μg) was preincubated with 10 μg of either control rat IgG or anti-B7-H3 (MIH35) mAb, and then added to TLT-2/DO11.10 cells followed by streptavidin-PE. (Lower) TLT-2/DO11.10 cells were preincubated with 10 μg of either control IgM or anti-TLT-2 (MIH49) mAb, followed by B7-H3Ig-biotin and streptavidin-PE. The negative control stained with biotinylated human IgG and streptavidin-PE is presented as shaded histograms. The MFI values are indicated next to the legends.
Fig. 2.
Fig. 2.
TLT-2 expression on immune cells. (A) Freshly isolated and activated CD4+ and CD8+ T cells stimulated with anti-CD3 mAb for 2 days were stained with FITC-anti-CD4 or anti-CD8 mAb and biotinylated anti-TLT-2 mAb, followed by streptavidin-APC or the appropriate fluorochrome-conjugated control mAbs. (Top and Middle) The data for TLT-2 expression gated on CD4+ or CD8+ cells are displayed as histograms with the control histograms nearest the ordinate (shaded histograms). (Bottom) RT-PCR analysis of TLT-2. Serially (4-fold) diluted cDNAs from freshly isolated or Con A-activated CD4+ and CD8+ T cells, and freshly isolated CD4+CD25+ T cells were analyzed. (B) TLT-2 expression in splenocytes, peritoneal exudate cells (PEC), and BM-DC. Freshly isolated splenocytes and PEC, and either unstimulated or LPS-stimulated BM-DCs were stained with FITC-anti-B220, anti-CD49b (DX5), anti-CD11c or anti-CD11b and biotinylated anti-TLT-2 (MIH47) mAb, followed by streptavidin-APC or the appropriate fluorochrome-conjugated control mAbs. The data for TLT-2 expression gated on the respective antigen are displayed as histograms with the control histograms nearest the ordinate (shaded).
Fig. 3.
Fig. 3.
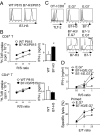
B7-H3 costimulates CD8+ T cell responses. (A) WT P815 and B7-H3/P815 transfectants were stained with isotype control Ab or FITC-anti-B7-H3 (MIH32) mAb. Cell surface B7-H3 on WT P815 and B7-H3/P815 cells is presented as histograms with the control staining (shaded). (B) CD8+ or CD4+ T cells were cocultured with the indicated ratio of WT P815 or B7-H3/P815 in the presence of anti-CD3 mAb (0.4 μg/ml for CD8+ T cells and 0.1 μg/ml for CD4+ T cells) for 3 days. Proliferative responses in the final 18 h were assessed by [3H]thymidine incorporation. The IFN-γ levels in the culture supernatants at 48 h were measured by ELISA. The cpm counts and IFN-γ production for CD8+ or CD4+ T cells stimulated with anti-CD3 mAb alone and CD8+ or CD4+ T cells cocultured with P815 cells in the absence of anti-CD3 mAb were <2,500 cpm and < 0.015 ng/ml, respectively. Values shown are the mean ± SD. The data are representative of three independent experiments. (C) TLT-2 expression on OT-I CD8+ cells (Left). OT-I CD8+ cells were stained for TLT-2, as described in Fig. 2C. B7-H3 and B7–1 expression on E.G7 and E.G7 transfectants (Right). E.G7, B7-H3/E.G7, and B7–1/E.G7 were stained with FITC-anti-B7-H3 mAb or PE-anti-B7–1 mAb or the appropriate fluorochrome-conjugated control Ig. The data are presented as histograms, with the respective control staining (shaded). (D) Enhanced IFN-γ production (Upper) and cytotoxicity (Bottom) of OT-I CD8+ T cells costimulated with B7-H3-transfectants. OT-I CD8+ cells were stimulated with the indicated ratio of control E.G7, B7-H3/E.G7, or B7–1/E.G7 cells for 48 h. The IFN-γ levels in the supernatants were measured by ELISA. OT-I CD8+ T cells were cocultured with E.G7 or B7-H3/E.G7 for 3 days and cytotoxicity against E.G7 was measured by the JAM test. Values shown are the mean specific lysis ± SD. The data are representative of three independent experiments. *, statistically different from the WT control (P < 0.05).
Fig. 4.
Fig. 4.
Interaction of B7-H3 with TLT-2 enhances T cell activation. (A) Enhanced IL-2 production as a result of TLT-2:B7-H3 binding. (Left) TLT-2 expression on DO11.10 cells. GFP/DO11.10 and TLT-2/DO11.10 cells were stained as described in Fig. 2C. (Right) IL-2 production by TLT-2/DO11.10. The DO11.10 cells were cocultured with the indicated ratio of WT P815 or B7-H3/P815 cells in the presence of 1 μg/ml anti-CD3 mAb for 24 h. The IL-2 levels in the supernatants were measured by ELISA. The IL-2 levels in the culture without stimulator cells were <0.015 ng/ml. (B) Enhanced IFN-γ production by CD4+ and CD8+ T cells as a result of TLT-2:B7-H3 binding. (Left) Activated CD4+ and CD8+ T cells were retrovirally transduced with pMXs-IG (GFP) or TLT-2-IRES-eGFP (TLT-2) and stained for TLT-2 expression. GFP+ cells were sorted by flow cytometry and used as responder cells (indicated by squared section). (Right) Control GFP+ or TLT-2+GFP+ cells were stimulated with WT P815 or B7-H3/P815 at an R/S ratio of two for 72 h and the IFN-γ production was determined by ELISA. The IFN-γ levels from CD8+ or CD4+ T cells stimulated with anti-CD3 mAb alone and CD8+ or CD4+ T cells cocultured with P815 cells in the absence of anti-CD3 mAb were <0.015 ng/ml. Values shown are mean ± SD. All data are representative of three independent experiments.
Fig. 5.
Fig. 5.
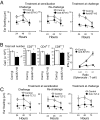
Blockade of the B7-H3-TLT-2 pathway impairs CH responses. (A) Anti-B7-H3 mAb treatment at sensitization or challenge inhibits ear swelling. CH to DNFB was induced as described in Materials and Methods. The anti-B7-H3 (MIH35) mAb was injected i.p. 2 h before each sensitization or challenge. The secondary challenge (rechallenge) was performed 28 days after the primary challenge. The differences in ear thickness before and after challenge are displayed as ear swelling values (mean ± SD for each group of five mice). The data shown are representative of three independent experiments. (B) Anti-B7-H3 mAb treatment decreases CD8+ T cell expansion and hapten-specific IFN-γ production. Regional LNs from mice treated with control Ig or anti-B7-H3 mAb at sensitization were analyzed 3 days after the final sensitization. Cells were analyzed by flow cytometry. The percentages of CD3+, CD4+CD3+, and CD8+CD3+ cells are presented as CD3+ T, CD4+ T, and CD8+ T cells, respectively. LN-T cells from control Ig- or anti-B7-H3 mAb-treated mice were stimulated with DNBS-pulsed splenocytes for 48 h, and IFN-γ production was measured. Values shown are the mean ± SD for each group of three mice. The data are representative of two independent experiments. (C) Anti-TLT-2 mAb treatment at sensitization or challenge inhibits ear swelling. CH was induced and treatment with anti-TLT-2 (MIH49) mAb and rechallenge were performed as described in A. Values shown are the mean ± SD for each group of five mice. Data are representative of two independent experiments. Groups showing statistically significant differences from the control Ig-treated group are marked (*, P < 0.05).

Comment in

  • The contrasting role of B7-H3.
    Hofmeyer KA, Ray A, Zang X. Hofmeyer KA, et al. Proc Natl Acad Sci U S A. 2008 Jul 29;105(30):10277-8. doi: 10.1073/pnas.0805458105. Epub 2008 Jul 23. Proc Natl Acad Sci U S A. 2008. PMID: 18650376 Free PMC article. No abstract available.

References

    1. Carreno BM, Collins M. The B7 family of ligands and its receptors: New pathways for costimulation and inhibition of immune responses. Annu Rev Immunol. 2002;20:29–53. - PubMed
    1. Chen L. Co-inhibitory molecules of the B7-CD28 family in the control of T-cell immunity. Nat Rev Immunol. 2004;4:336–347. - PubMed
    1. Greenwald RJ, Freeman GJ, Sharpe AH. The B7 family revisited. Annu Rev Immunol. 2005;23:515–548. - PubMed
    1. Chapoval AI, et al. B7–H3: A costimulatory molecule for T cell activation and IFN-γ production. Nat Immunol. 2001;2:269–274. - PubMed
    1. Ferlazzo G, et al. T lymphocytes express B7 family molecules following interaction with dendritic cells and acquire bystander costimulatory properties. Eur J Immunol. 2002;32:3092–3101. - PubMed

Publication types

MeSH terms