. 2008 Sep;148(1):436-54.
doi: 10.1104/pp.108.121038. Epub 2008 Jul 23.

Global analysis of Arabidopsis gene expression uncovers a complex array of changes impacting pathogen response and cell cycle during geminivirus infection

Affiliations

Global analysis of Arabidopsis gene expression uncovers a complex array of changes impacting pathogen response and cell cycle during geminivirus infection

José Trinidad Ascencio-Ibáñez et al. Plant Physiol. 2008 Sep.

Abstract

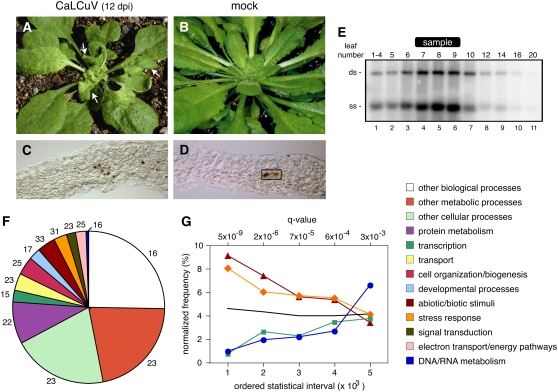
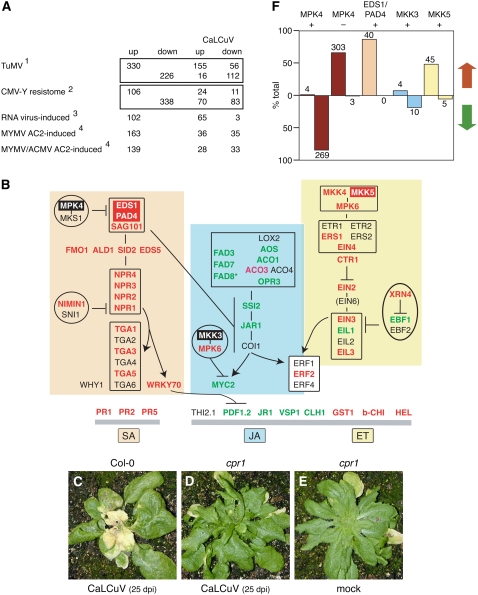
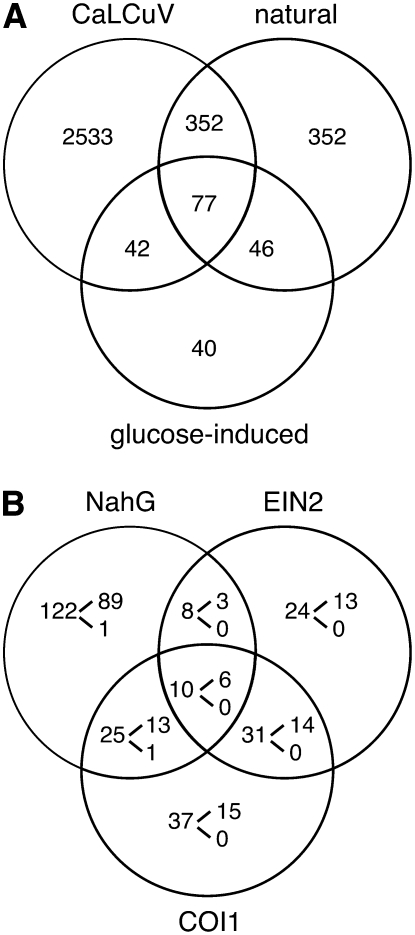
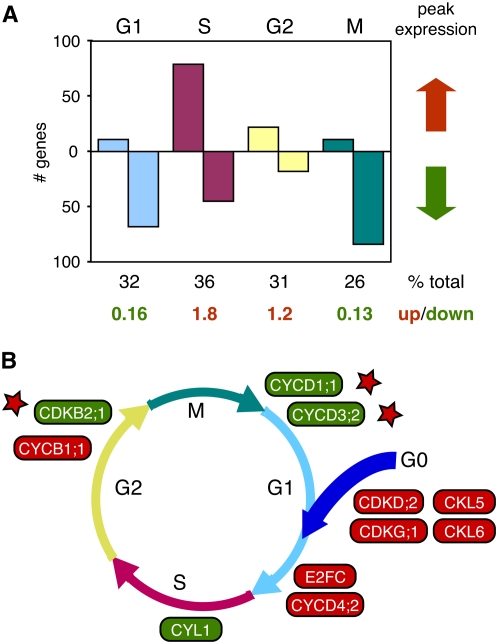
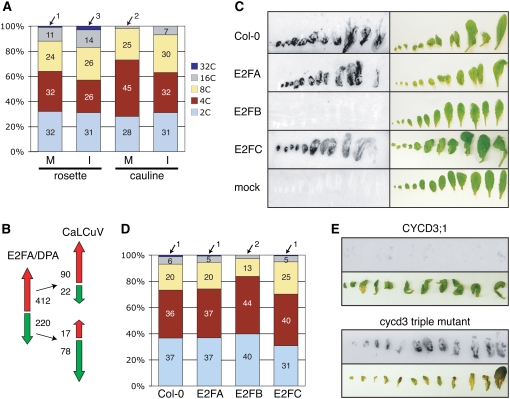
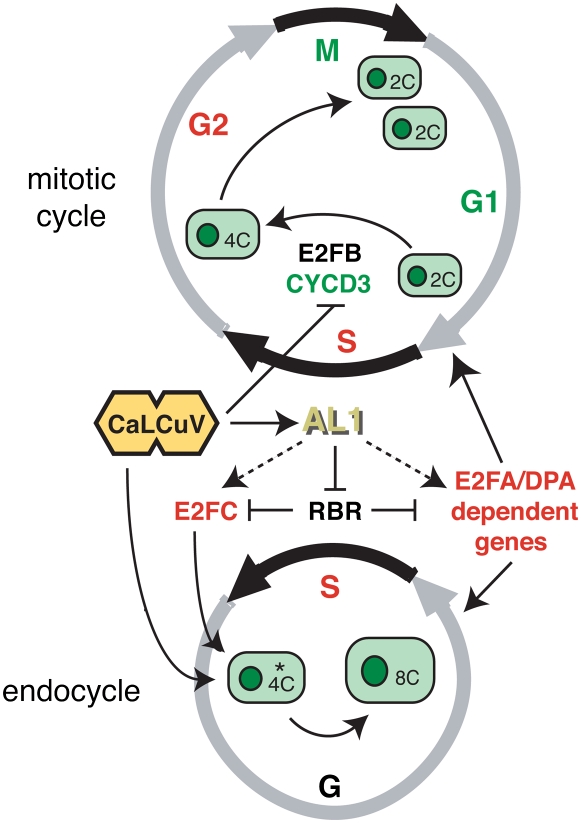
Geminiviruses are small DNA viruses that use plant replication machinery to amplify their genomes. Microarray analysis of the Arabidopsis (Arabidopsis thaliana) transcriptome in response to cabbage leaf curl virus (CaLCuV) infection uncovered 5,365 genes (false discovery rate <0.005) differentially expressed in infected rosette leaves at 12 d postinoculation. Data mining revealed that CaLCuV triggers a pathogen response via the salicylic acid pathway and induces expression of genes involved in programmed cell death, genotoxic stress, and DNA repair. CaLCuV also altered expression of cell cycle-associated genes, preferentially activating genes expressed during S and G2 and inhibiting genes active in G1 and M. A limited set of core cell cycle genes associated with cell cycle reentry, late G1, S, and early G2 had increased RNA levels, while core cell cycle genes linked to early G1 and late G2 had reduced transcripts. Fluorescence-activated cell sorting of nuclei from infected leaves revealed a depletion of the 4C population and an increase in 8C, 16C, and 32C nuclei. Infectivity studies of transgenic Arabidopsis showed that overexpression of CYCD3;1 or E2FB, both of which promote the mitotic cell cycle, strongly impaired CaLCuV infection. In contrast, overexpression of E2FA or E2FC, which can facilitate the endocycle, had no apparent effect. These results showed that geminiviruses and RNA viruses interface with the host pathogen response via a common mechanism, and that geminiviruses modulate plant cell cycle status by differentially impacting the CYCD/retinoblastoma-related protein/E2F regulatory network and facilitating progression into the endocycle.


Figures

Figure 1.
Figure 1.
CaLCuV infection differentially impacts Arabidopsis gene expression across functional categories. CaLCuV symptoms in Arabidopsis Col-0 rosette leaves at 12 dpi are shown in A. The arrows mark the size of leaves harvested for RNA extraction. The mock-inoculated plant at 12 dpi is shown in B. Immunolocalization of the AL1 protein in leaf 9 of a CaLCuV-infected plant at 12 dpi can be observed in C. D, Control section from an equivalent, mock-inoculated leaf. Endogenous peroxidase activity is seen in vascular tissue (rectangle). Total DNA (0.5 μg) from a CaLCuV-infected plant at 12 dpi was analyzed by DNA gel blotting using a 32P-labeled probe corresponding to full-length CaLCuV A DNA. In E, the DNA samples were from a pool of leaves 1 to 4 (lane 1) or individual leaves (lanes 2–11). The leaves are numbered according to their positions relative to the shoot apex from the youngest (1–4, lane 1) to the oldest (20, lane 11). The bands corresponding to double-stranded (ds) and single-stranded (ss) forms of CaLCuV A are identified on the left. The leaves used for the microarray experiments are marked at the top (sample). A pie chart showing the distribution of the differentially expressed genes across functional categories defined by the TAIR7 GO is depicted in F. The numbers are the percentage of genes in each category differentially expressed during infection. Interval analysis of selected functional groups can be seen in G. Genes were ordered according to their q values and grouped into intervals of 1,000. The frequencies of selected functional classes normalized to their overall representation in the GO database were plotted for five intervals corresponding to the 5,000 genes with the lowest P values. The abiotic/biotic stimulus is represented by triangles, the stress response by diamonds, DNA/RNA metabolism by circles, and transcription by squares. The colors of the lines are the same as in F. The black line corresponds to the mean representation of all GO categories for each interval.
Figure 2.
Figure 2.
Pathogen response during CaLCuV infection. Genes differentially expressed during CaLCuV infection were compared to the expression profiles of Arabidopsis genes that change in response to other plant pathogens or pathogen proteins. A, The comparisons include: (1) genes differentially expressed during the compatible TuMV infection (Yang et al., 2007); (2) genes differentially expressed during the resistance response to CMV-Y (Marathe et al., 2004); (3) transcripts elevated by five RNA viruses in planta (Whitham et al., 2003); and (4) transcripts increased in cultured cells expressing MYMV or ACMV AC2 protein (Trinks et al., 2005). The numbers of shared genes that are up- or down-regulated in CaLCuV-infected leaves are indicated for each comparison. The totals for each treatment were adjusted to include only genes represented on the ATH1 array. B, A model of the interactions between key genes involved in the SA (orange), JA (blue), and ET (yellow) pathogen response pathways. The genes are shown in their proposed order in the regulatory network or order of expression. Genes with elevated mRNA levels are in red typeface, while genes with reduced mRNA are in green typeface. The genes with red or black backgrounds are in F. The corresponding Arabidopsis gene numbers are in Supplemental Table S1. C, Infected Col-0 plant showing signs of senescence and cell death at 25 dpi is depicted. CaLCuV-inoculated cpr1 mutant (Bowling et al., 1994) at 25 dpi is shown in D, followed by a mock-inoculated cpr1 mutant at 25 dpi (E). Graph in F shows the percentage of overlap of mRNAs that are increased (red arrow) or decreased (green arrow) during CaLCuV infection to genes with reduced (MPK4 +) or elevated (MPK4 −) transcripts in an mpk4 mutant (Andreasson et al., 2005), with reduced RNA in an eds1/pad4 mutant (EDS1/PAD4 +; Bartsch et al., 2006), or with increased RNA in MKK3 (+)- or MKK5 (+)-overexpressing lines (Takahashi et al., 2007). The number of genes is indicated for each bar.
Figure 3.
Figure 3.
CaLCuV infection induces senescence. A, Genes differentially expressed during CaLCuV infection at 12 dpi compared to genes that are up-regulated during natural senescence (Buchanan-Wollaston et al., 2005) and Glc-induced senescence (Pourtau et al., 2006). B, Genes differentially expressed during infection compared to genes (first number in each section) that are expressed in response to SA (NahG), ET (ein2), or JA (coi1) during senescence (Buchanan-Wollaston et al., 2005). The numbers of mRNAs elevated during infection are given at the top of the bracket, while the numbers of depressed transcripts are given below.
Figure 4.
Figure 4.
CaLCuV infection alters expression of cell cycle genes. Cell cycle-associated genes that are up-regulated (red arrow) or down-regulated (green arrow) in CaLCuV-infected leaves are grouped according to their peak expression phase (top) during the cell division cycle (Menges et al., 2003) can be seen in A. The total number of genes associated with each phase that are differentially expressed during infection and the ratio of increased versus reduced transcripts are shown at the bottom. B, A model showing the core cell cycle transcripts that are higher (red) or lower (green) during CaLCuV infection is proposed. Each gene is positioned where it is thought to act or shows peak expression during the cell division cycle or during reentry (Menges et al., 2005). The stars mark three genes with reduced transcripts in infected leaves and function at the indicated cell cycle stage. The Arabidopsis gene numbers for the genes in A and C are in Supplemental Table S1.
Figure 5.
Figure 5.
Ploidy and infectivity studies of wild-type Arabidopsis and plants altered in the CYCD/RBR/E2F pathway. A, Ploidy distribution of nuclei from rosette and cauline leaves of mock-inoculated and infected Arabidopsis plants. The percentage of 2C, 4C, 8C, 16C, or 32C nuclei in each FACS profile is indicated. The experiment was repeated twice with similar results (data not shown). B, A comparison of CaLCuV expression profile to the RNA profile of transgenic Arabidopsis overexpressing E2FA and its DPA partner is presented (Vandepoele et al., 2005). The red and green arrows indicate increased and reduced transcripts, respectively. The number of genes represented by each arrow is indicated. C, Viral DNA in leaves from mock and CaLCuV-inoculated Col-0, E2FA-, E2FB-, or E2FC-overexpressing plants was detected by tissue printing at 12 d after bombardment. The leaves were photographed prior to rubbing onto nylon membrane. D, Ploidy distribution of nuclei from untreated, mature rosette leaves of Col-0, E2FA-, E2FB-, or E2FC-overexpressing plants is presented. The percentage of 2C, 4C, 8C, 16C, or 32C nuclei from FACS profile is indicated. The experiment was repeated twice with similar results (data not shown). E, Viral DNA in leaves from mock and CaLCuV-inoculated plants carrying a triple knockout in CYCD3;1, 2, and 3 or overexpressing CYCD3;1 was detected by tissue printing at 22 d after bombardment.
Figure 6.
Figure 6.
Model for CaLCuV induction of the endocycle. During infection, CaLCuV selectively infects the 4C cell population (marked by the asterisk) predisposed to undergo endoreduplication but not 2C or 4C cells in the mitotic cycle. The viral AL1 protein, which is produced very early in the infection process, binds to RBR and relieves repression of E2FC and E2FA, leading to activation of S phase genes and an increase in endocycling cells. Up-regulation of E2FC expression also promotes the endocycle during infection, while down-regulation of CYCD3 expression prevents the mitotic cycle possibly through suppression of E2FB activity. Genes with elevated transcripts in CaLCuV-infected leaves are in red, while genes with reduced mRNAs are in green.

References

    1. Accotto GP, Mullineaux PM, Brown SC, Marie D (1993) Digitaria streak geminivirus replicative forms are abundant in S-phase nuclei of infected cells. Virology 195 257–259 - PubMed
    1. Anaya-López JL, Pérez-Mora E, Torres-Pacheco I, Muñoz-Sánchez CI, Guevara-Olvera L, González-Chavira M, Ochoa-Alejo N, Rivera-Bustamante RF, Guevara-González RG (2005) Inducible gene expression by Pepper huasteco virus in Capsicum chinense plants with resistance to geminivirus infections. Can J Plant Pathol 27 276–282
    1. Andreasson E, Jenkins T, Brodersen P, Thorgrimsen S, Petersen NH, Zhu S, Qiu JL, Micheelsen P, Rocher A, Petersen M, et al (2005) The MAP kinase substrate MKS1 is a regulator of plant defense responses. EMBO J 24 2579–2589 - PMC - PubMed
    1. Arguello-Astorga G, Lopez-Ochoa L, Kong LJ, Orozco BM, Settlage SB, Hanley-Bowdoin L (2004) A novel motif in geminivirus replication proteins interacts with the plant retinoblastoma homolog RBR. J Virol 78 4817–4826 - PMC - PubMed
    1. Ascencio-Ibañez JT, Settlage SB (2007) DNA abrasion onto plants is an effective method for geminivirus infection and virus-induced gene silencing. J Virol Methods 142 198–203 - PubMed

Publication types

Substances

LinkOut - more resources