. 2008 Sep 26;283(39):26612-23.
doi: 10.1074/jbc.M801500200. Epub 2008 Jul 23.

Spatiotemporal regulation of ERK2 by dual specificity phosphatases

Affiliations

Spatiotemporal regulation of ERK2 by dual specificity phosphatases

Christopher J Caunt et al. J Biol Chem. .

Abstract

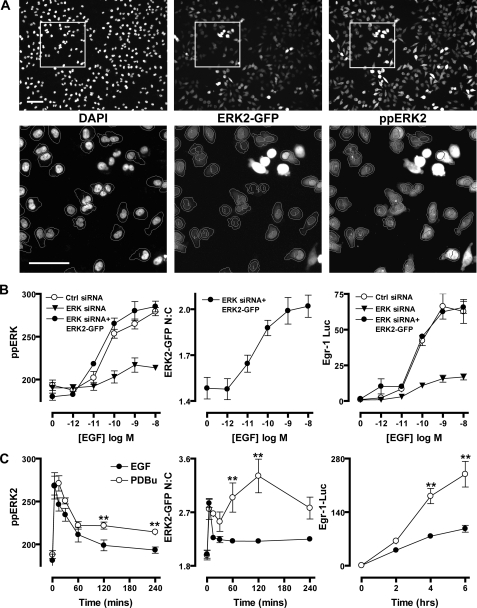
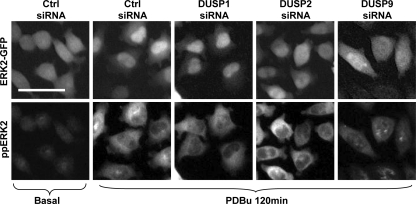
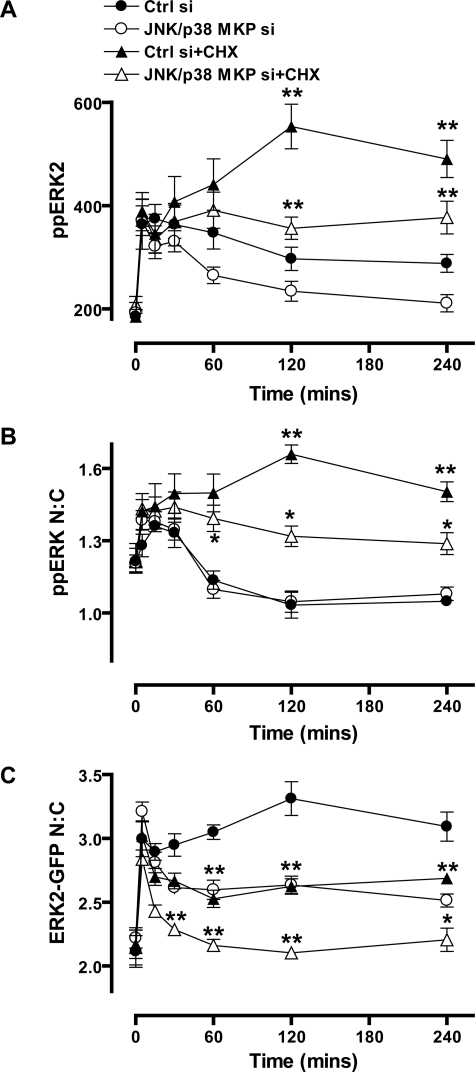
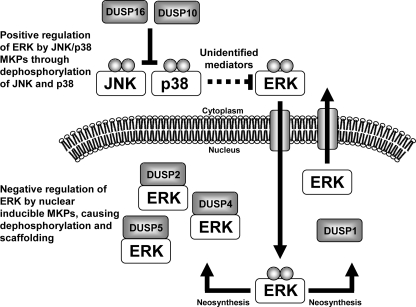
Although many stimuli activate extracellular signal-regulated kinases 1 and 2 (ERK1/2), the kinetics and compartmentalization of ERK1/2 signals are stimulus-dependent and dictate physiological consequences. ERKs can be inactivated by dual specificity phosphatases (DUSPs), notably the MAPK phosphatases (MKPs) and atypical DUSPs, that can both dephosphorylate and scaffold ERK1/2. Using a cell imaging model (based on knockdown of endogenous ERKs and add-back of wild-type or mutated ERK2-GFP reporters), we explored possible effects of DUSPs on responses to transient or sustained ERK2 activators (epidermal growth factor and phorbol 12,13-dibutyrate, respectively). For both stimuli, a D319N mutation (which impairs DUSP binding) increased ERK2 activity and reduced nuclear accumulation. These stimuli also increased mRNA levels for eight DUSPs. In a short inhibitory RNA screen, 12 of 16 DUSPs influenced ERK2 responses. These effects were evident among nuclear inducible MKP, cytoplasmic ERK MKP, JNK/p38 MKP, and atypical DUSP subtypes and, with the exception of the nuclear inducible MKPs, were paralleled by corresponding changes in Egr-1 luciferase activation. Simultaneous removal of all JNK/p38 MKPs or nuclear inducible MKPs revealed them as positive and negative regulators of ERK2 signaling, respectively. The effects of JNK/p38 MKP short inhibitory RNAs were not dependent on protein neosynthesis but were reversed in the presence of JNK and p38 kinase inhibitors, indicating DUSP-mediated cross-talk between MAPK pathways. Overall, our data reveal that a large number of DUSPs influence ERK2 signaling. Together with the known tissue-specific expression of DUSPs and the importance of ERK1/2 in cell regulation, our data support the potential value of DUSPs as targets for drug therapy.


Figures

FIGURE 1.
FIGURE 1.
High content imaging methods for studying ERK1/2 regulation. A, cells were transfected with ERK1/2 siRNAs and transduced with Ad ERK2-GFP. Following treatment, cells were stained, and images were acquired for DAPI, ERK2-GFP, and ppERK2 stains, as described under “Experimental Procedures.” Top panels show whole fields of acquired images, and bottom panels show blow-up images of areas denoted by white squares. Outlines on lower panels denote the segmentation of individual cells according to DAPI and ERK2-GFP intensity using Multitarget Analysis software. Cells without outlines indicate cells excluded from analysis either for expressing superphysiological levels of ERK2-GFP or failing to meet other criteria needed for accurate segmentation. Bars, 100 μm. B, cells were transfected with control (Ctrl) siRNAs, ERK1/2 siRNAs, or ERK1/2 siRNAs as well as Ad ERK2-GFP as indicated. Cells were stimulated for 5 min with indicated concentrations of EGF before fixation, ppERK1/2 staining, image acquisition, and analysis as described in A to assess whole-cell levels of ERK1/2 phosphorylation (ppERK, left panel) and nucleocytoplasmic distribution of ERK2-GFP (ERK2-GFP N:C, middle panel). For Egr-1 luciferase assays, Ad Egr-1 luciferase and Ad CMV β-galactosidase vectors were also added to cells before stimulation with EGF for 6 h and assay of luciferase activity (Egr-1 Luc), as described under “Experimental Procedures,” and are expressed as fold change compared with unstimulated conditions. C, cells were transfected with ERK1/2 siRNAs and transduced with Ad ERK2-GFP (with or without Ad Egr-1 luciferase and Ad CMV β-galactosidase), prior to stimulation with 10 nm EGF or 1 μm PDBu, as indicated, in time course studies. Cells were fixed and assessed for ppERK2 levels (left panel) and ERK2-GFP N:C localization (middle panel) simultaneously, or lysed and assayed for luciferase activity (right panel) as described in B. Data shown are from four separate experiments (mean ± S.E., n = 4). ** = p < 0.01, comparing PDBu and EGF-stimulated cells using two-way ANOVA and Bonferroni post hoc tests.
FIGURE 2.
FIGURE 2.
Influence of D-domains on the potency of ERK2 signaling. Cells transfected with ERK1/2 siRNAs were transduced with Ad wild-type (WT) or D319N-mutated ERK2-GFP and analyzed for activation, localization, and transcriptional activation as follows. A–C, cells were stimulated in 96-well plates with the indicated concentrations of EGF for 5 min and stained before image acquisition and analysis (as described in Fig. 1) for the calculation of whole-cell ppERK2 intensity (A), the ERK2-GFP N:C ratio (B), and whole-cell ERK2-GFP (N+C) levels (C). D, cells were additionally transduced with Ad Egr-1 luciferase and Ad CMVβ-galactosidasevectorsbeforestimulationwithindicatedconcentrationsof EGF for 6 h and prior to lysis and luciferase assay (as described in Fig. 1) for the assessment of egr-1 promoter activity. Data shown were obtained from three separate experiments, each with duplicate wells (mean± S.E., n = 3). * = p < 0.05 and ** = p < 0.01, comparing WT with D319N conditions, according to two-way ANOVA and Bonferroni post hoc tests.
FIGURE 3.
FIGURE 3.
Enhancement of ERK2 signaling by D319N mutation of ERK2-GFP. A–C, cells transfected with ERK1/2 siRNAs were transduced with Ad wild-type (WT) or D319N-mutated ERK2-GFP as indicated prior to stimulation with 10 nm EGF (A) or 1 μm PDBu (B and C) for the times indicated. Cells were stained before image acquisition and analysis (as described in Fig. 1) for the calculation of whole-cell ppERK2 intensity (A and B, left panels), ppERK2 N:C ratio (A and B, middle-left panels), and the ERK2-GFP N:C ratio (A and B, middle-right panels). Cells were additionally transduced with Ad Egr-1 luciferase and Ad CMV β-galactosidase vectors before stimulation to assess Egr-1 induction by luciferase assay as described in Fig. 1 (A and B, right panels). Data shown were obtained from three separate experiments, each with duplicate wells (mean ± S.E., n = 3). * = p < 0.05 and ** = p < 0.01, comparing WT with D319N conditions, according to two-way ANOVA and Bonferroni post hoc tests. C, representative cropped images, collected under conditions described in A and B showing differences in ERK2-GFP distribution (top panels) and ppERK2 levels (bottom panels) following stimulation with 1 μm PDBu as indicated. Bar, 50 μm.
FIGURE 4.
FIGURE 4.
Stimulus and ERK dependence of DUSP transcription and effects of DUSP siRNAs on ERK2 signaling. A, cells were transfected in 6-well plates with control siRNAs (Ctrl) or ERK1/2 siRNAs and transduced with Ad wild-type (WT) or D319N-mutated ERK2-GFP as indicated. Cells were either left unstimulated (Basal) or treated with 10 nm EGF (left panel) or 1 μm PDBu (right panel) for 120 min. Total RNA isolates were analyzed for relative levels of DUSP2 mRNA using qPCR protocols described under “Experimental Procedures.” Data shown are average values from three independent experiments represented as fold change from basal levels and presented as a heat map. DUSPs are grouped according to sequence similarity and substrate specificity, and data included are values found to differ significantly from control (basal) conditions using one-way ANOVA and Dunnett's post hoc test, accepting p < 0.05 as significant. B, cells were transfected in 96-well plates with 1 nm ERK1/2 siRNAs and 10 nm control (Ctrl) or siRNA SMARTpools targeting individual DUSPs (as indicated) before addition of Ad ERK2-GFP. Cells were stimulated with 1 μm PDBu or 10 nm EGF as indicated, prior to staining and imaging (as described in Fig. 1). Data are expressed in the heat map as the extent of difference above or below control values for each condition and time point for ppERK2 intensity (left panel) and ERK2-GFP N:C ratio (right panel) from four separate experiments performed in duplicate. Targets are again grouped according to sequence similarity and substrate specificity. Statistical analysis was performed using one-way ANOVA and Dunnett's post hoc test, accepting p < 0.05 as significant. Nonsignificant changes are shown as white blocks for both experiments.
FIGURE 5.
FIGURE 5.
DUSP siRNAs affect spatiotemporal ERK2-GFP regulation. Cells were transfected in 96-well plates with 1 nm ERK1/2 siRNAs and 10 nm control (Ctrl) or siRNA SMARTpools targeting individual DUSPs (as indicated) before addition of Ad ERK2-GFP. Cells were stimulated with 1 μm PDBu as indicated, prior to staining and imaging (as described under Fig. 1). Representative cropped images are shown for each condition from ERK2-GFP (top panels) and ppERK2 images (bottom panels). Bar, 50 μm.
FIGURE 6.
FIGURE 6.
Comparison of ERK2-GFP activation, localization, and regulation of Egr-1 following DUSP knockdown. Cells were transfected with 1 nm ERK1/2 siRNAs and 10 nm control (Ctrl) or siRNA SMARTpools targeting individual DUSPs (as indicated) before addition of Ad ERK2-GFP. Top and middle panels, cells were either left unstimulated (basal) or treated with 1 μm PDBu or 10 nm EGF for 120 min as indicated, prior to staining and imaging (as described in Fig. 1). Bottom panel, cells were additionally transduced with Ad Egr-1 luciferase and Ad CMV β-galactosidase vectors before stimulation with 1 μm PDBu or 10 nm EGF for 6 h as indicated to assess Egr-1 induction by luciferase assay (as described in Fig. 1). Data are expressed as average ppERK2 values (top panel), ERK2-GFP N:C ratio (middle panel), and fold change in Egr-1 luciferase activity compared with unstimulated control siRNA-transfected cells (bottom panel) and were obtained from three separate experiments, each with duplicate observations (mean ± S.E., n = 3). * = p < 0.05 and ** = p < 0.01, comparing DUSP and control siRNA conditions for each stimulus, according to one-way ANOVA and Dunnett's post hoc test.
FIGURE 7.
FIGURE 7.
Contribution of DUSP subfamilies to ERK2 regulation. A, cells were transfected with ERK1/2 siRNAs and either 40 nm control siRNAs (Ctrl si), 40 nm nuclear inducible MKP siRNAs (Nuc Ind MKP si, 10 nm each of DUSP1, -2, -4, and -5 siRNAs), 40 nm cytoplasmic ERK MKP siRNAs (Cyt ERK MKP si, 10 nm each of DUSP6, -7, -9 and ctrl siRNAs), or 40 nm JNK/p38 siRNAs (JNK/p38 MKP si, 10 nm each of DUSP10 and -16 siRNAs with 20 nm ctrl siRNAs) as indicated. Cells were transduced with Ad ERK2-GFP prior to stimulation with 1 μm PDBu for the times indicated. Cells were stained before image acquisition and analysis (as described in Fig. 1) for the calculation of whole-cell ppERK2 intensity (top panels), ppERK2 N:C ratio (middle panels), and the ERK2-GFP N:C ratio (lower panels). B, representative cropped images for control siRNA and nuclear inducible MKP siRNA conditions (as indicated) collected as described (A, left panels) and showing differences in ERK2-GFP (top panels) and ppERK2 (bottom panels) distribution following stimulation with 1 μm PDBu as indicated. Bar, 50 μm. C, cells treated as described in A were additionally transduced with Ad Egr-1 luciferase and Ad CMV β-galactosidase vectors before stimulation with PDBu for times indicated to assess Egr-1 induction by luciferase assay (as described in Fig. 1). Data shown in A and C were obtained from four separate experiments, each with duplicate wells (mean± S.E., n = 4). * = p < 0.05 and **= p < 0.01, comparing control siRNA to test conditions, according to two-way ANOVA and Bonferroni post hoc tests.
FIGURE 8.
FIGURE 8.
Effects of protein synthesis inhibition on JNK/p38 MKP regulation of ERK2. A–C, cells were transfected with 1 nm ERK1/2 siRNAs and either 40 nm control siRNAs (Ctrl si) or 40 nm JNK/p38 siRNAs (JNK/p38 MKP si, 10 nm each of DUSP10 and -16 siRNAs with 20 nm ctrl siRNAs) as indicated. Cells were transduced with Ad ERK2-GFP prior to treatment with 30 μm cycloheximide (CHX) as indicated for 30 min prior to stimulation with 1 μm PDBu for the times indicated. Cells were stained before image acquisition and analysis (as described in Fig. 1) for the calculation of whole-cell ppERK2 intensity (A), ppERK2 N:C ratio (B), and the ERK2-GFP N:C ratio (C). Data shown in all panels were obtained from four separate experiments, each with duplicate wells (mean ± S.E., n = 4). * = p < 0.05 and ** = p < 0.01, comparing control and JNK/p38 siRNA conditions to those with CHX, according to two-way ANOVA and Bonferroni post hoc tests.
FIGURE 9.
FIGURE 9.
Effects of JNK and p38 kinase inhibition on JNK/p38 MKP regulation of ERK2. Cells were transfected with 1 nm ERK1/2 siRNAs and either 40 nm control siRNAs (Ctrl si) or 40 nm JNK/p38 siRNAs (JNK/p38 MKP si, 10 nm each of DUSP10 and -16 siRNAs with 20 nm ctrl siRNAs) as indicated. Cells were transduced with Ad ERK2-GFP prior to treatment with 10 μm SP600125 (SP) or 20 μm SB203580 (SB) as indicated for 30 min prior to stimulation with 1 μm PDBu for 120 min. Cells were stained before image acquisition and analysis (as described in Fig. 1) for the calculation of whole-cell ppERK2 intensity (middle panel) and the ERK2-GFP N:C ratio (lower panel). Cells in the upper panel were treated as described above but were additionally transduced with Ad Egr-1 luciferase and Ad CMV β-galactosidase vectors before stimulation with 1 μm PDBu for 6 h prior to assessment of Egr-1 induction by luciferase assay (as described in Fig. 1). Data shown were obtained from three separate experiments, each with triplicate wells (mean ± S.E., n = 3). * = p < 0.05 and ** = p < 0.01, comparing JNK/p38 siRNA conditions with and without SP600125 (SP) or SB203580 (SB), according to one-way ANOVA and Dunnett's post hoc tests.
FIGURE 10.
FIGURE 10.
Model of ERK2 regulation by nuclear inducible and JNK/p38 MKPs. ERK2 activation and translocation to the nucleus causes neosynthesis of the nuclear inducible MKPs (DUSP1, -2, -4, and -5) that collectively mediate both dephosphorylation and scaffolding of ERK2 in the nucleus. Previous studies have revealed that all nuclear inducible MKPs can contribute to ERK2 dephosphorylation, but only DUSP2, -4, and -5 stably associate with ERK2, whereas DUSP1 inactivates and releases ERK2 for reactivation in the cytosol (18, 19). This presumably facilitates sustained ERK2 signals in the face of persistent upstream stimuli. In contrast, we find that the JNK/p38 MKPs (DUSP10 and -16) have a positive role in ERK2 regulation by inactivating JNK and p38 kinases. The proteins that mediate negative cross-talk between the JNK, p38, and ERK2 pathways have not been identified in this system but have been defined in others (46).

Similar articles

Cited by

References

    1. Caunt, C. J., Finch, A. R., Sedgley, K. R., and McArdle, C. A. (2006) Trends Endocrinol. Metab. 17 276-283 - PubMed
    1. Ebisuya, M., Kondoh, K., and Nishida, E. (2005) J. Cell Sci. 118 2997-3002 - PubMed
    1. Murphy, L. O., and Blenis, J. (2006) Trends Biochem. Sci. 31 268-275 - PubMed
    1. Chen, R. H., Sarnecki, C., and Blenis, J. (1992) Mol. Cell. Biol. 12 915-927 - PMC - PubMed
    1. Lenormand, P., Sardet, C., Pages, G., L'Allemain, G., Brunet, A., and Pouyssegur, J. (1993) J. Cell Biol. 122 1079-1088 - PMC - PubMed

Publication types

MeSH terms

Substances