. 2008 Nov;19(11):2119-29.
doi: 10.1681/ASN.2007101108. Epub 2008 Jul 23.

Inhibition of SNAT2 by metabolic acidosis enhances proteolysis in skeletal muscle

Affiliations

Inhibition of SNAT2 by metabolic acidosis enhances proteolysis in skeletal muscle

Kate Evans et al. J Am Soc Nephrol. 2008 Nov.

Abstract

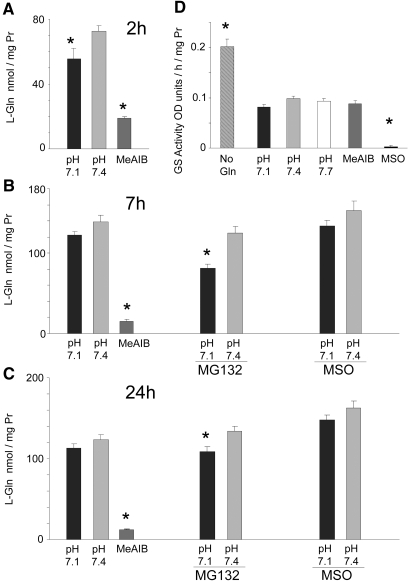
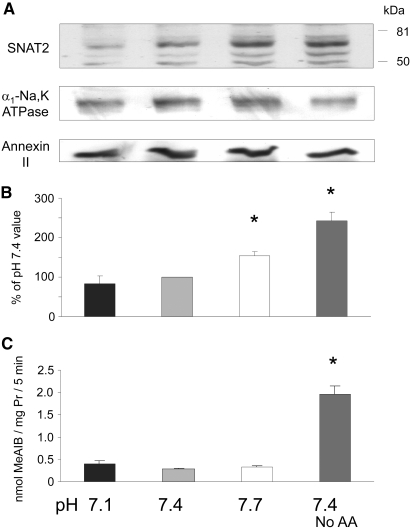
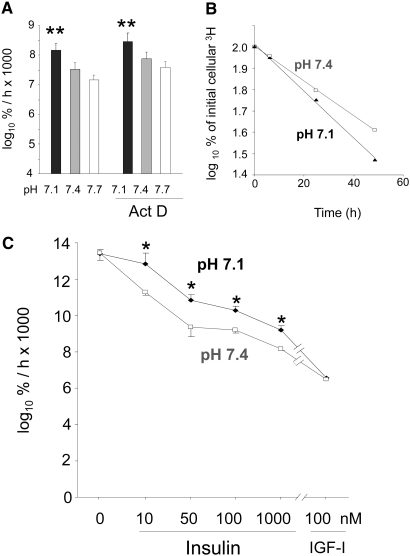
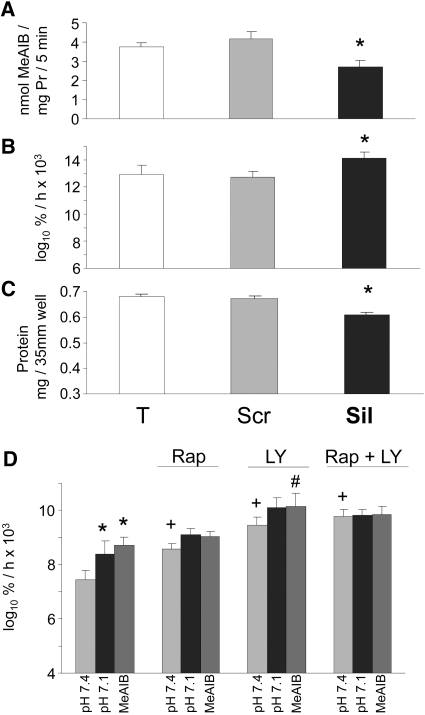
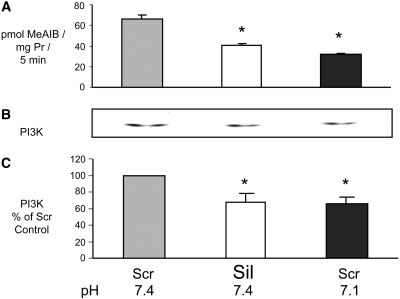
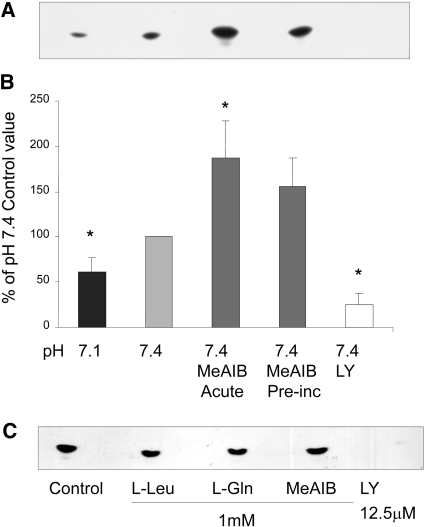
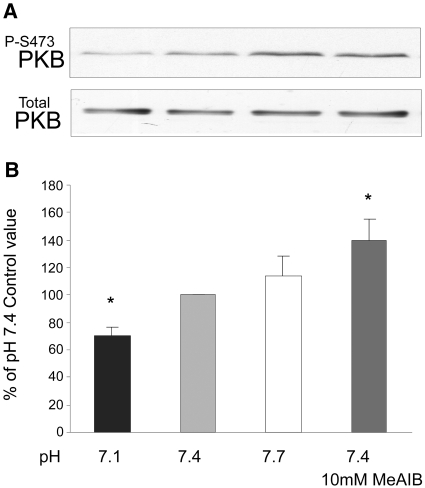
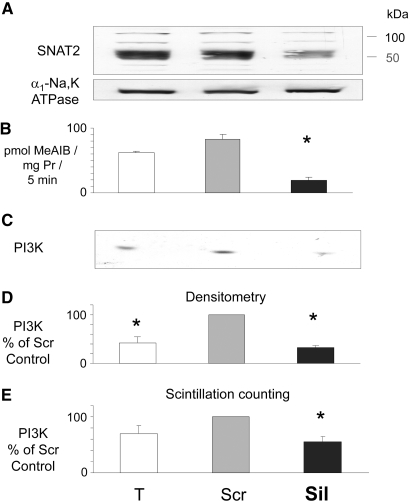
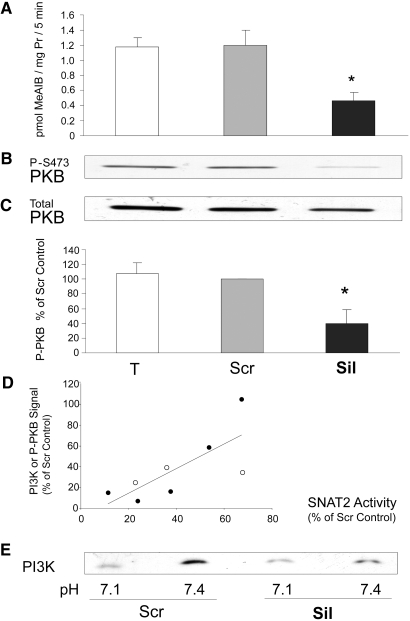
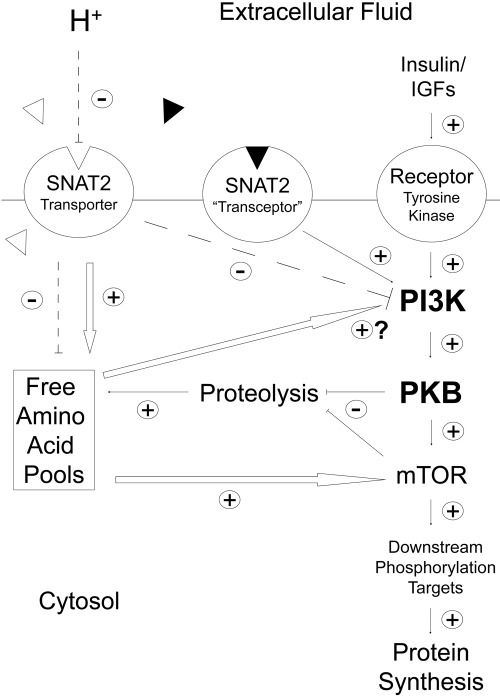
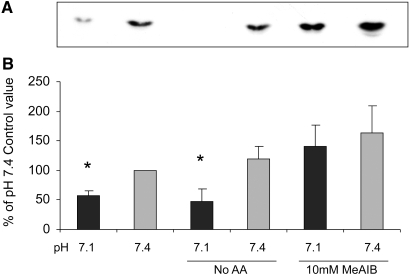
Insulin resistance is a major cause of muscle wasting in patients with ESRD. Uremic metabolic acidosis impairs insulin signaling, which normally suppresses proteolysis. The low pH may inhibit the SNAT2 l-Glutamine (L-Gln) transporter, which controls protein synthesis via amino acid-dependent insulin signaling through mammalian target of rapamycin (mTOR). Whether SNAT2 also regulates signaling to pathways that control proteolysis is unknown. In this study, inhibition of SNAT2 with the selective competitive substrate methylaminoisobutyrate or metabolic acidosis (pH 7.1) depleted intracellular L-Gln and stimulated proteolysis in cultured L6 myotubes. At pH 7.1, inhibition of the proteasome led to greater depletion of L-Gln, indicating that amino acids liberated by proteolysis sustain L-Gln levels when SNAT2 is inhibited by acidosis. Acidosis shifted the dose-response curve for suppression of proteolysis by insulin to the right, confirming that acid increases proteolysis by inducing insulin resistance. Blocking mTOR or phosphatidylinositol-3-kinase (PI3K) increased proteolysis, indicating that both signaling pathways are involved in its regulation. When both mTOR and PI3K were inhibited, methylaminoisobutyrate or acidosis did not stimulate proteolysis further. Moreover, partial silencing of SNAT2 expression in myotubes and myoblasts with small interfering RNA stimulated proteolysis and impaired insulin signaling through PI3K. In conclusion, SNAT2 not only regulates mTOR but also regulates proteolysis through PI3K and provides a link among acidosis, insulin resistance, and protein wasting in skeletal muscle cells.


Figures

Figure 1.
Figure 1.
(A through C) Time course of the effect of low pH or MeAIB (10 mM) on the intracellular concentration of L-Gln in L6-G8C5 myotubes, with MG132 (10 μM) or methionine sulfoximine (MSO; 1 mM). Media were based on MEM and contained 2 mM L-Gln with 2% dialyzed FBS. Pooled data from three independent experiments are shown (with at least three replicate culture wells for each treatment). In 24-h incubations, MG132 and MSO were present only for the last 7 h. (D) l-Glutamine synthetase catalytic activity in lysates from L6-G8C5 myotubes incubated for 48 h at pH 7.4 without L-Gln or with 2 mM L-Gln at the specified pH or with 2 mM L-Gln at pH 7.4 with 10 mM MeAIB or 1 mM MSO. Fresh medium of the same composition was added after 24 h. Pooled data from five independent experiments are shown (with at least three replicate culture wells for each treatment). *P < 0.05 versus the corresponding control value at pH 7.4.
Figure 2.
Figure 2.
Effect of 6 h of incubation in MEM with 2% dialyzed FBS at the specified pH or at pH 7.4 with no amino acids (No AA), on SNAT2 expression in L6-G8C5 myotubes. (A) Immunoblots of proteins separated by SDS-PAGE from a 170,000 × g membrane preparation, probing with SNAT2-specific antibody (or α1-Na,K-ATPase antibody or Annexin II antibody as loading controls). (B) Quantification by densitometry of the principal 65-kD SNAT2 band in blots as in A. Pooled data are presented from four independent experiments. (C) Assay of SNAT2 transporter activity. After 6 h of incubation, cultures were rinsed with HEPES-buffered balanced salt solution (at pH 7.4 for all cultures), and uptake of 14C-labeled MeAIB was measured at 25°C (see the Concise Methods section). Representative assay from three independent experiments. *P < 0.05 versus the pH 7.4 control value.
Figure 3.
Figure 3.
(A) Effect of 1 μM Actinomycin D (Act D) on proteolysis rate in L6-G8C5 myotubes during 7-h incubations at the specified pH in MEM + 2 mM L-Phe + 2% dialyzed FBS. Pooled data from four independent experiments are shown (with three replicate culture wells for each treatment). Proteolysis was assessed from the rate of release of radioactivity into the medium from cultures prelabeled with 3H-L-Phe and is expressed as the logarithm of the percentage of the total initial cellular radioactivity per hour (log10 %/h × 1000; see the Concise Methods section). (B) Typical delabeling time course of 3H-L-Phe–prelabeled cells incubated in serum-free MEM + 2 mM L-Phe at the specified pH with 100 nM insulin. Linear regression slopes of plots of this type are presented in A and C and Figure 4. (C) Effect of pH, insulin, and high-dosage IGF-1 on the rate of proteolysis (delabeling) expressed as log10 %/h × 1000 in L6-G8C5 myotubes. Pooled data from three independent experiments are shown (with three replicate culture wells for each treatment). *P < 0.05 versus the corresponding pH 7.4 control value; **P < 0.05 versus the corresponding pH 7.7 value.
Figure 4.
Figure 4.
(A through C) Effect of siRNA silencing of SNAT2 in L6-G8C5 myotubes. Pooled data from three independent experiments are shown (with three replicate culture wells for each treatment). T, cultures incubated with calcium phosphate transfection blank; Scr, scrambled control siRNA; Sil, SNAT2 silencing siRNA. Transfection was followed by an 8-h incubation in DMEM + 10% FBS followed by 16 h in MEM + 2% dialyzed FBS. All measurements were then made in parallel as follows: SNAT2 transporter activity (A) and proteolysis rate during 24 h in MEM + 2 mM L-Phe + 2% dialyzed FBS at pH 7.4 (B). Cultures were prelabeled by incubating with 3H-L-Phe for 72 h (including the transfection incubation) before the delabeling measurements. (C) Protein content of the cultures in B. *P < 0.05 versus Scr control. (D) Effect of 100 nM rapamycin (Rap) and 12.5 μM LY294002 (LY) on proteolysis rate in L6-G8C5 myotubes as in Figure 3B during incubation at pH 7.1, pH 7.4, or pH 7.4 with 10 mM MeAIB in serum-free MEM with 100 nM insulin. *P < 0.05 versus the corresponding pH 7.4 control value; +P < 0.05 versus cultures at pH 7.4 without Rap or LY; #P < 0.05 versus cultures with 10 mM MeAIB without LY. Pooled data from four independent experiments are shown (with three replicate culture wells for each treatment).
Figure 5.
Figure 5.
Comparison of the effects of siRNA silencing of SNAT2 and of acidosis on PI3K activity in L6-G8C5 myotubes. Transfection (see Figure 4) was followed by 24 h in DMEM + 10% FBS. Cells were subjected to an additional 2-h incubation in serum-free MEM, at the specified pH with 100 nM insulin before preparing lysates for PI3K assay. (A) SNAT2 transporter activity assayed at the specified pH. (B) Representative autoradiograph of thin-layer chromatography plate showing 32P-labeled phosphatidylinositol-3-phosphate generated by the PI3K lipid kinase reaction (see the Concise Methods section). (C) Quantification by densitometry of data pooled from three independent experiments performed as in B, expressed as percentage of the pH 7.4 Scr control value. *P < 0.05 versus the pH 7.4 Scr control.
Figure 6.
Figure 6.
(A and B) Effect on PI3K activity in L6-G8C5 myotubes of 2-h incubations at the specified pH with or without 10 mM MeAIB or 12.5 μM LY294002. All media contained serum-free MEM with 100 nM insulin. Acute, cultures in which MeAIB was present during the 2-h incubation; Preinc, cultures in which MeAIB was absent during the 2-h incubation but had been present in the preceding 4 h in MEM with 2% dialyzed FBS. (A) Representative PI3K assay autoradiograph. (B) Pooled quantification data obtained by densitometry of six independent experiments performed as in A, expressed as percentage of the control value at pH 7.4. *P < 0.05 versus the pH 7.4 control. (C) Effect of incubation of PI3K immunoprecipitates with amino acids or LY294002 only during the kinase assay incubation with 32P-ATP. Representative autoradiograph from one of two experiments.
Figure 7.
Figure 7.
Effect on PKB activation in L6-G8C5 myotubes of 2-h incubations at the specified pH with or without 10 mM MeAIB as in Figure 6. All media contained serum-free MEM with 100 nM insulin. (A) Representative immunoblot showing PKB activation assessed from phosphorylation of PKB at Ser 473. (B) Pooled quantification data from 18 independent experiments performed as in A expressed as percentage of the control value at pH 7.4. *P < 0.05 versus the pH 7.4 control.
Figure 8.
Figure 8.
Effect of siRNA silencing of SNAT2 on PI3K activity as in Figure 5 but with L6-G8C5 myoblasts. (A) Confirmation by immunoblotting of SNAT2 silencing. Proteins from a 170,000 × g membrane preparation separated by SDS-PAGE were probed with SNAT2-specific antibody (or α1-Na,K-ATPase antibody as a loading control). Experiments in B through E were run in parallel on the same cells. Pooled data from three independent experiments are presented. (B) SNAT2 transporter activity. (C) Representative autoradiograph of PI3K assay thin-layer chromatography plate. (D) Quantification of pooled experiments performed as in C. (E) Quantification by liquid scintillation counting of 32P spots scraped from the plates in D. *P < 0.05 versus the Scr control.
Figure 9.
Figure 9.
(A through C) Effect of siRNA silencing of SNAT2 on PKB activation in L6-G8C5 myoblasts as in Figure 8. Experiments were run in parallel on the same cells. Pooled data from five independent experiments are presented. (A) SNAT2 transporter activity. (B) Representative immunoblot showing PKB activation assessed from phosphorylation of PKB at Ser 473. (C) Quantification by densitometry of pooled experiments performed as in B, expressed as percentage of the Scr control value. *P < 0.05 versus the Scr control. (D) Correlation between the degree of silencing of SNAT2 and the accompanying degree of inhibition of the P-PKB and PI3K signals. Data are plotted from the five PKB experiments in A and C (•) and the three PI3K experiments in Figure 8, B and D (○). Spearman rank correlation coefficients: All data R = 0.74, P < 0.04; PKB data only R = 0.90, P < 0.04. (E) Representative experiment showing the effect of pH on the residual PI3K activity in myoblasts in which SNAT2 had been silenced as in Figure 8, but the ensuing 2-h incubation with 100 nM insulin was performed either at pH 7.1 or at pH 7.4.
Figure 10.
Figure 10.
Proposed scheme whereby the pH-sensitive SNAT2 amino acid transporter and the putative SNAT2/amino acid substrate “transceptor” complex influence amino acid signaling and global proteolysis in L6-G8C5 rat skeletal muscle cells. Dashed lines denote the inhibitory effect of low extracellular pH on the SNAT2 transporter and the resulting inhibition of PI3K and depletion of intracellular free amino acid pools. White arrows indicate known or suspected effects of amino acids whose intracellular concentrations are directly (e.g., L-Gln) or indirectly (e.g., L-Leu) regulated by SNAT2 transporter activity. ▵, Naturally occurring metabolizable amino acid substrates of SNAT2; ▴, synthetic nonmetabolizable SNAT2 substrate MeAIB.
Figure 11.
Figure 11.
Influence of amino acid starvation (No AA) or saturation of SNAT2 with 10 mM MeAIB on the pH sensitivity of PI3K lipid kinase activity in L6-G8C5 myotubes. Cells were incubated for 2 h at the specified pH with or without amino acids or MeAIB. All media contained serum-free MEM with 100 nM insulin. For No AA cultures, this 2-h incubation was preceded by 2 h in MEM without amino acids and with 2% dialyzed FBS. (A) Representative PI3K assay autoradiograph. (B) Pooled quantification data obtained by densitometry of three independent experiments performed as in A. *P < 0.05 versus the corresponding pH 7.4 control.

References

    1. Siew ED, Pupim LB, Majchrzak KM, Shintani A, Flakoll PJ, Ikizler TA: Insulin resistance is associated with skeletal muscle protein breakdown in non-diabetic chronic hemodialysis patients. Kidney Int 71: 146–152, 2007 - PubMed
    1. Lee SW, Park GH, Lee SW, Song JH, Hong KC, Kim MJ: Insulin resistance and muscle wasting in non-diabetic end-stage renal disease patients. Nephrol Dial Transplant 22: 2554–2562, 2007 - PubMed
    1. Mitch WE: Metabolic and clinical consequences of metabolic acidosis. J Nephrol 19[Suppl 9]: S70–S75, 2006 - PubMed
    1. Baird FE, Pinilla-Tenas JJ, Ogilvie WL, Ganapathy V, Hundal HS, Taylor PM: Evidence for allosteric regulation of pH-sensitive System A (SNAT2) and System N (SNAT5) amino acid transporter activity involving a conserved histidine residue. Biochem J 397: 369–375, 2006 - PMC - PubMed
    1. Evans K, Nasim Z, Brown J, Butler H, Kauser S, Varoqui H, Erickson JD, Herbert TP, Bevington A: Acidosis-sensing glutamine pump SNAT2 determines amino acid levels and mammalian target of rapamycin signalling to protein synthesis in L6 muscle cells. J Am Soc Nephrol 18: 1426–1436, 2007 - PubMed

Publication types

MeSH terms

LinkOut - more resources