. 2009 Feb;31(2):157-63.
doi: 10.1097/SHK.0b013e31817fbf4d.

Differential immunological phenotypes are exhibited after scald and flame burns

Affiliations

Differential immunological phenotypes are exhibited after scald and flame burns

Johannes Tschöp et al. Shock. 2009 Feb.

Abstract

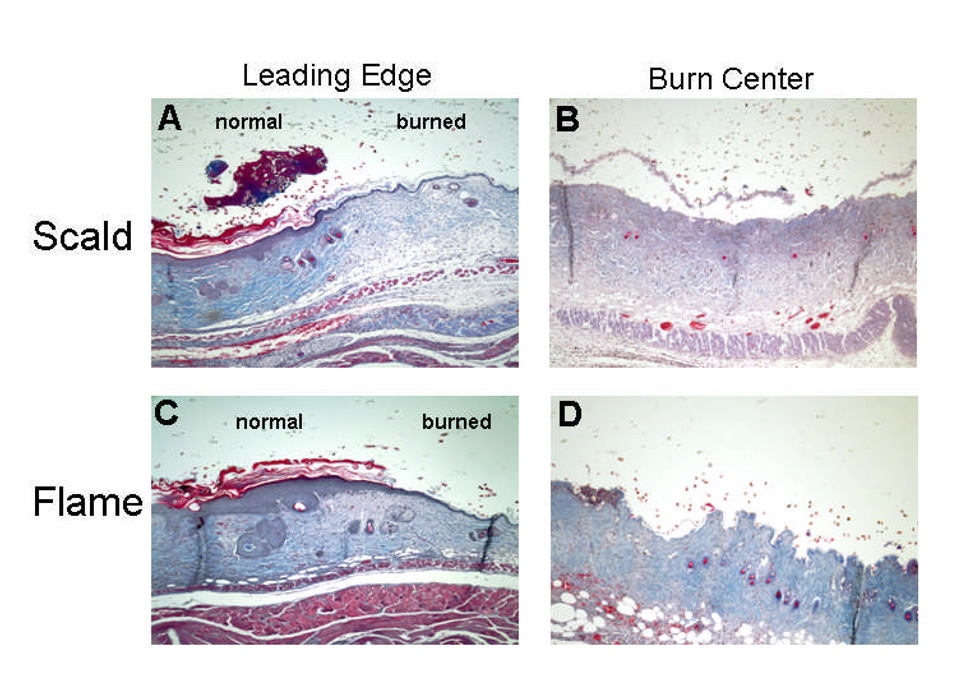
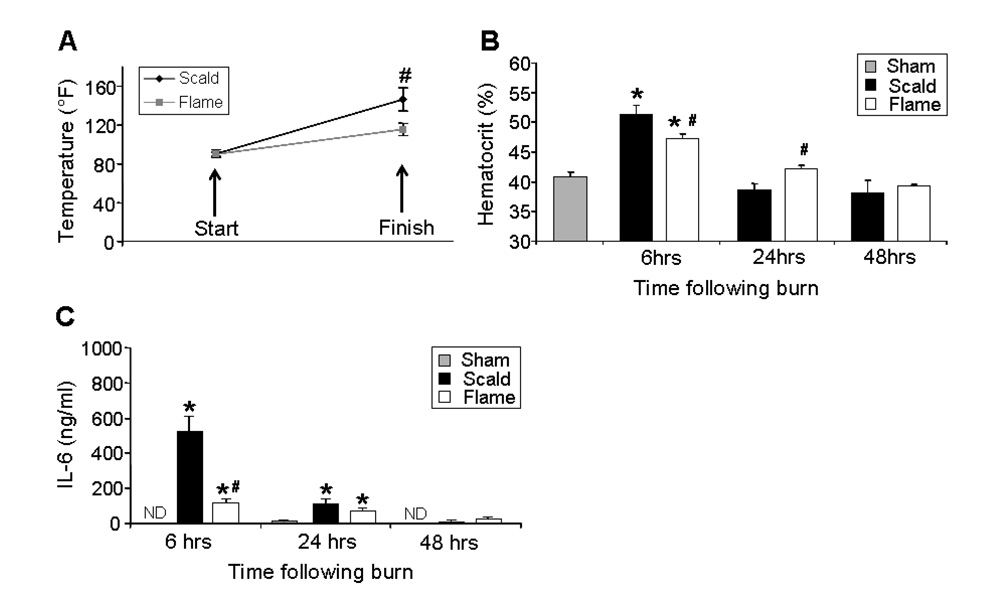
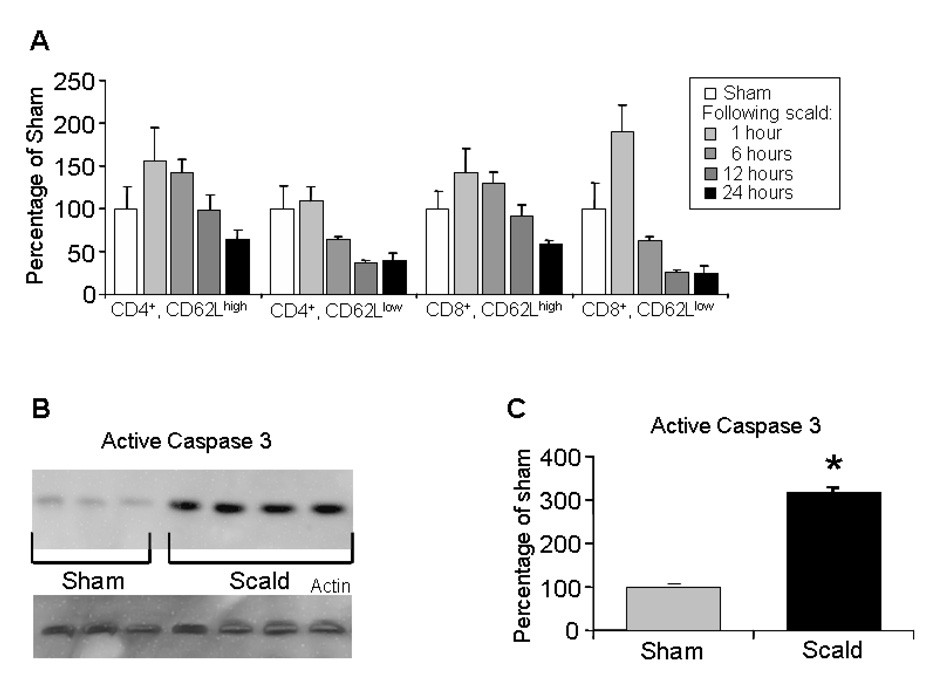
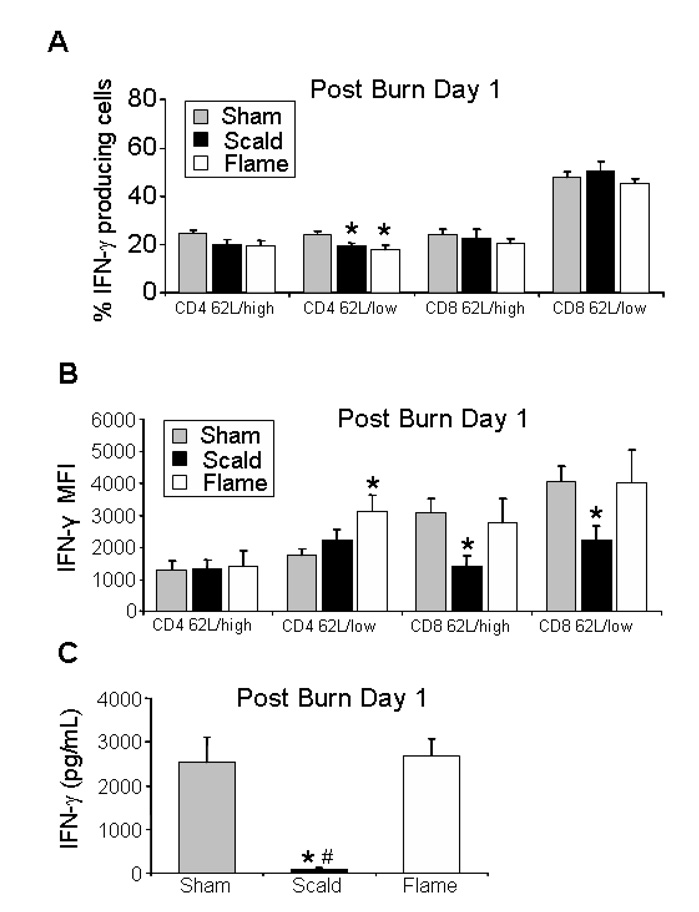
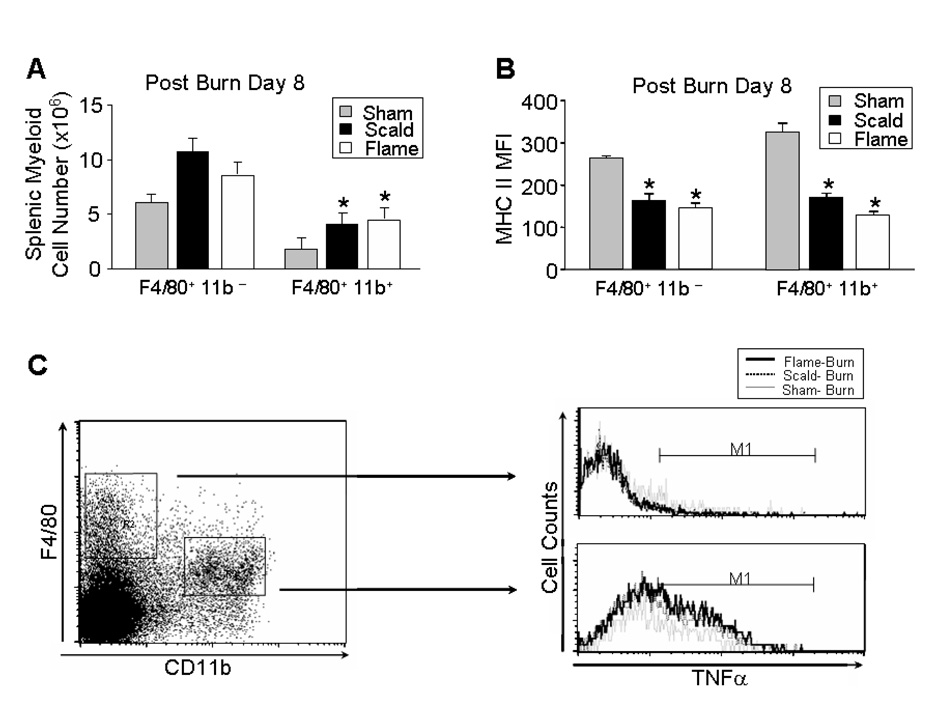
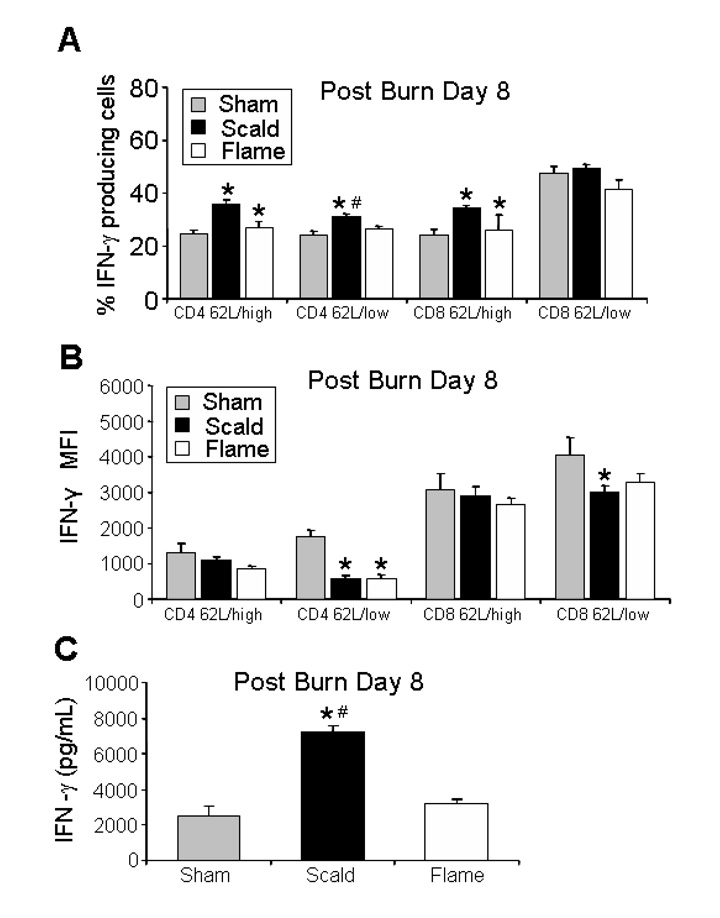
A dysfunctional immune system is known to be part of the pathophysiology after burn trauma. However, reports that support this have used a variety of methods, with numerous variables, to induce thermal injury. We hypothesized that, all other parameters being equal, an injury infliction by a scald would yield different immunological responses than one inflicted by a flame. Here, we demonstrated that both burn methods produced a full-thickness burn, yet there was more of an increase in subdermal temperature, hematocrit, mortality, and serum IL-6 concentrations associated with the scald burn. On postinjury day 1, the scald-burned mice showed diminished lymphocyte numbers, interferon gamma production, and lymphocyte T-bet expression as compared with sham- and flame-burned mice. On postburn day 8, spleens from both sets of thermally injured animals showed an increase in proinflammatory myeloid cells as compared with sham-burned mice. Furthermore, the T-cell numbers, T-bet expression, and phenotype were changed such that interferon gamma production was higher in scald-burned mice than in sham- and flame-burned mice. Altogether, the data show that differential immunological phenotypes were observed depending on the thermal injury method used.


Figures

Fig. 1
Fig. 1
Thermal injury induced by flame or scald method results in a full-thickness burn. A–D, Representative histological sections of dorsal skin taken from a scald- (A/B) and flame-burned mouse (C/D), respectively. The magnification is ×12.5.
Fig. 2
Fig. 2
Changes in subdermal temperature, hematocrit, and systemic IL-6 vary in response to different thermal injury. A, Subdermal temperature at the beginning and end of a 9-s burn is measured as described in “Materials and methods.” B, The hematocrit associated with each model of thermal injury. C, IL-6 concentrations at the indicated time after thermal injury from scald- and flame-burned mice as measured by ELISA. The sample size is four to six for each experiment. *P < 0.05 as compared with wild type; †P < 0.05 as compared with flame. ND indicates not detected.
Fig. 3
Fig. 3
Differential spleen mass and absolute lymphocyte numbers 1 day after thermal injury 24 h after the indicated thermal injury. A, The ratio of the body and spleen mass was determined. Furthermore, lymphocytes were counted and analyzed by flow cytometry. The numbers and type of T cells from peripheral blood (B), thymus (C), and spleen (D) were determined. *P < 0.05 as compared with wild type; †P < 0.05 as compared with flame. The sample size is 7 to 11 from two combined experiments. DP indicates double positive for CD4 and CD8; DN, double negative for CD4 and CD8; SP, single positive.
Fig. 4
Fig. 4
Thermal injuries result in differential T-cell function and caspase-3–mediated T-cell depletion. After sham burn or thermal injury, splenic T cells were isolated, purified, counted, and prepared for immunoblot. A, The percentage of conventional T cells as compared with sham-burned mice taken from scalded mice at the indicated time. B, An immunoblot demonstrating active caspase 3 in T-cell samples isolated from sham- or scald-burned mice. C, Denosometric analysis of immunoblot. *P < 0.05 as compared with sham burn.
Fig. 5
Fig. 5
Varied functional differences in T cells 1 day after scald and flame thermal injury. Ex vivo splenic T cells were stimulated with plate-bound anti-CD3 and CD28 mAb, and 18 h later, the cells were analyzed for the percentage (A), and intensity (B) of IFN-γ production. In a parallel set of experiments, the supernatants (C) were analyzed for IFN-γ accumulation by ELISA. The sample size for the number determination is seven to nine and is combined from two independent experiments. *P < 0.05 as compared with wild type; †P < 0.05 as compared with flame. MFI indicates mean fluorescence intensity.
Fig. 6
Fig. 6
Differential absolute myeloid cell numbers and phenotypes 8 days after thermal injury. Splenic myeloid cells were counted and analyzed by flow cytometry for the absolute numbers of macrophage subsets (A) 8 days after the indicated thermal injury. B, Mean fluorescence intensity (MFI) of MHC II expression. Cells were stimulated with LPS and then analyzed by CD11b, F4/80, and intracellular TNF-α expression by flow cytometry (C). The sample size for the number determination is 8 to 12 and is combined from two independent experiments. The M1 gate is set such that the isotype control yields less than 5% expression. *P < 0.05 vs. sham.
Fig. 7
Fig. 7
Differential absolute lymphocyte numbers 8 days after thermal injury. Splenic lymphocytes were counted and analyzed by flow cytometry 8 days after the indicated thermal injury. The number and phenotypes of peripheral blood (A), thymus (B), and splenic T lymphocytes (C) were determined. *P < 0.05 as compared with wild type; †P < 0.05 as compared with flame. The sample size is 8 to 12 from two combined experiments. DN indicates double negative for CD4 and CD8; DP, double positive for CD4 and CD8; SP, single positive.
Fig. 8
Fig. 8
Varied functional differences in T cells 8 days after scald and flame thermal injury. Ex vivo splenic T cells were stimulated with plate-bound anti-CD3 and CD28 mAb 8 days after the indicated thermal injury, and 18 h later, the percentage (A) and intensity (B) of IFN-γ production were determined. In a parallel set of experiments the supernatants were analyzed for IFN-γ accumulation by ELISA (C). The sample size for the number determination is seven to nine and is combined from two independent experiments. *P < 0.05 as compared with wild type; †P < 0.05 as compared with flame.

References

    1. Stieritz DD, Holder IA. Experimental studies of the pathogenesis of Pseudomonas aeruginosa infection: evidence for the in-vivo production of a lethal toxin. J Med Microbiol. 1978;11:101–109. - PubMed
    1. Cribbs RK, Luquette MH, Besner GE. A standardized model of partial thickness scald burns in mice. J Surg Res. 1998;80:69–74. - PubMed
    1. Greenhalgh DG. Models of wound healing. J Burn Care Rehabil. 2005;26:293–305. - PubMed
    1. Burleson DG, Mason AD, Jr, Pruitt BA., Jr Lymphoid subpopulation changes after thermal injury and thermal injury with infection in an experimental model. Ann Surg. 1988;207:208–212. - PMC - PubMed
    1. Patenaude J, D'Elia M, Hamelin C, Garrel D, Bernier J. Burn injury induces a change in T cell homeostasis affecting preferentially CD4+ T cells. J Leukoc Biol. 2005;77:141–150. - PubMed