. 2008 Aug 20;27(16):2239-49.
doi: 10.1038/emboj.2008.150. Epub 2008 Jul 24.

Structure of the Roc-COR domain tandem of C. tepidum, a prokaryotic homologue of the human LRRK2 Parkinson kinase

Affiliations

Structure of the Roc-COR domain tandem of C. tepidum, a prokaryotic homologue of the human LRRK2 Parkinson kinase

Katja Gotthardt et al. EMBO J. .

Erratum in

  • EMBO J. 2008 Sep 3;27(17):2352

Abstract

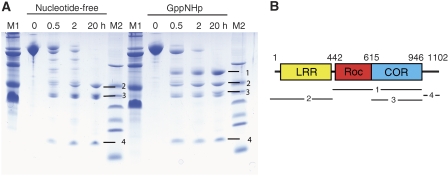
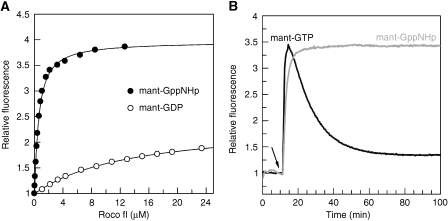
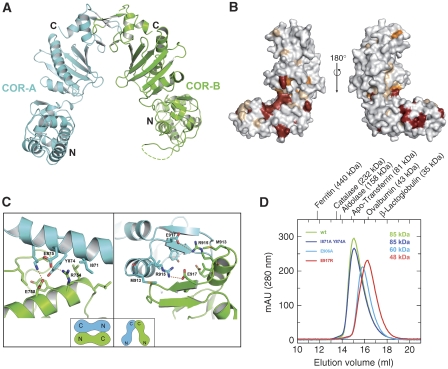
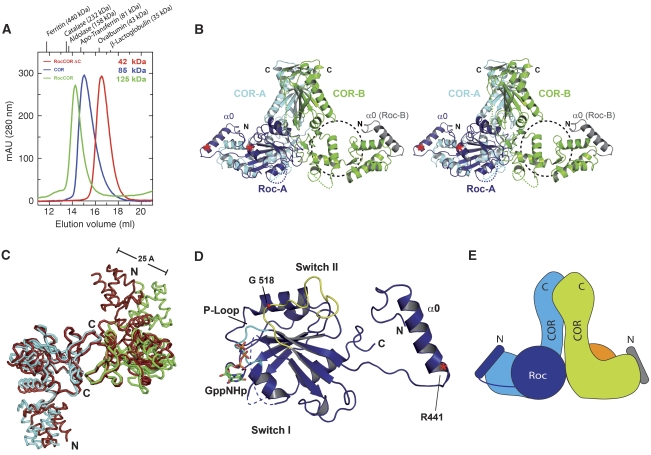
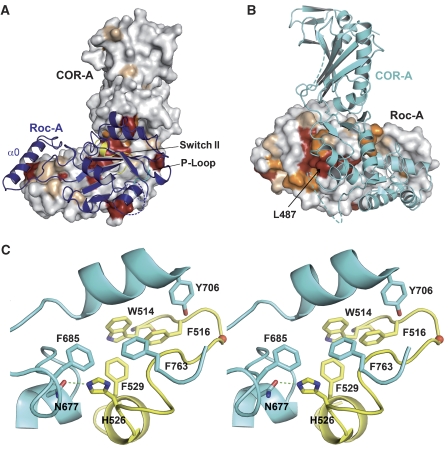
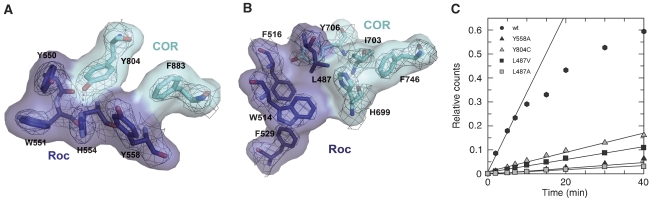
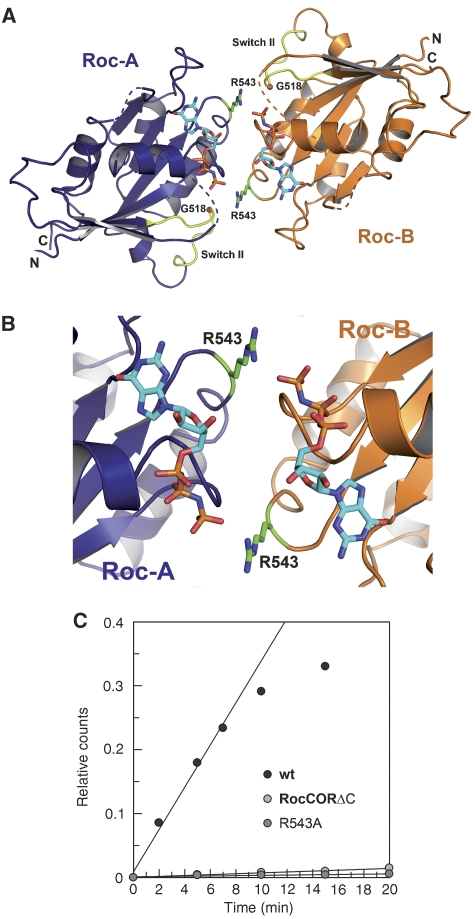
Ras of complex proteins (Roc) belongs to the superfamily of Ras-related small G-proteins that always occurs in tandem with the C-terminal of Roc (COR) domain. This Roc-COR tandem is found in the bacterial and eukaryotic world. Its most prominent member is the leucine-rich repeat kinase LRRK2, which is mutated and activated in Parkinson patients. Here, we investigated biochemically and structurally the Roco protein from Chlorobium tepidum. We show that Roc is highly homologous to Ras, whereas the COR domain is a dimerisation device. The juxtaposition of the G-domains and mutational analysis suggest that the Roc GTPase reaction is stimulated and/or regulated by dimerisation in a nucleotide-dependent manner. The region most conserved between bacteria and man is the interface between Roc and COR, where single-point Parkinson mutations of the Roc and COR domains are in close proximity. The analogous mutations in C. tepidum Roc-COR decrease the GTPase reaction rate, most likely due to a modification of the interaction between the Roc and COR domains.


Figures

Figure 1
Figure 1
Tryptic digestion of the C. tepidum Roco protein in the nucleotide-free (left lanes) and the GppNHp-bound state (right lanes) as described in Materials and methods. At the indicated time points of 0, 0.5, 2 and 20 h, samples were taken and analysed by PAGE, as indicated. M, molecular mass markers. (B) Scheme of the domain structure of C. tepidum Roco and the boundaries of fragments 1–4 obtained as indicated to the right of the gel in (A). Fragment 1 includes the Roc–COR tandem (442–946), 2 the LRR-domain (−6-441), 3 the COR domain (615–946) and 4 the C terminus (947–1090).
Figure 2
Figure 2
Biochemical analysis of C. tepidum Roco. (A) Affinities of fluorescent nucleotides measured by the fluorescence increase obtained by adding increasing concentrations of protein to 0.2 μM mant-GDP (empty circles) or mant-GppNHp (filled circles). The equilibrium constant KD was obtained by fitting the data to a quadratic equation. (B) Time-resolved fluorescence obtained by addition of 0.2 μM mant-GTP (black) or mant-GppNHp (grey) to 2 μM Roco protein. The addition of mant-nucleotide is indicated with a black arrow.
Figure 3
Figure 3
Structural analysis of the COR domain dimer. (A) Ribbon diagram of one (physiological dimer) of the COR dimers found in the crystal, with different protomers shown in green and cyan. Loops, that are not visible in the structure are indicated as dashed lines. (B) Surface representation of the COR monomer in two different orientations separated by 180°, with residues totally invariant between bacteria and man in red and those highly conserved in orange. (C) Details of the two dimer interfaces found in the crystal, including residues mutated for gel permeation chromatography analysis. Schematic drawings of the two types of dimers are shown in the insets. The interface on the right corresponds to the dimer in A and is the solution dimer. (D) Gel permeation analysis of wild-type and mutant COR proteins, with apparent molecular masses as obtained from equilibration with the indicated marker proteins.
Figure 4
Figure 4
Structure and properties of the Roc–COR tandem. (A) Gel permeation analysis of the COR domain, the Roc–COR tandem and Roc–COR-ΔC on an S200 gel permeation chromatography column, highlighting the apparent molecular masses obtained from equilibration with marker proteins. (B) Stereo-ribbon diagram of the Roc–COR dimer with colours for COR domains A and B as in Figure 3, and for Roc domain A and parts of Roc domain B in different shades of blue. The putative position of the non-visible G-domain is indicated with a dashed circle. Positions of the tryptic cleavages sites are marked with red asterisks. (C) Superimposition of the main chain worm plots of COR domains A and B from the free COR (red) and the Roc–COR (blue, cyan) structures, using the C-terminal domains for the overlay. (D) Ribbon plot of Roc domain A and helix α0, highlighting particular features as discussed in the text. The tryptic cleavage site (R441) is indicated with a red asterisk. (E) Schematic view of the complete Roc–COR dimer including the full Roc-B subunit. Disordered regions, not visible in the structure, are indicated with dashed lines.
Figure 5
Figure 5
The Roc–COR interface. (A) Ribbon model of Roc-A on the surface representation of COR-A, with invariant and conserved residues of COR as in Figure 3B. (B) Ribbon model of COR-A on the surface of Roc-A (180° orientation relative to (A)), with invariant and conserved residues taken from the sequence alignment (Supplementary Figure 1). (C) Detailed stereo view of the interface between Roc and COR interface, highlighting residues from switch II (yellow) of Roc and contacting residues from COR (cyan).
Figure 6
Figure 6
GTPase activity and Parkinson mutations. (A, B) Atomic model and corresponding 2fo-fc electron density (contoured at 1σ) of residues analogous to PD-related LRRK2 mutants and their location in the C. tepidum Roc/COR interface. Residues and surface of COR are coloured in cyan and of Roc in blue. (C) Multi-turnover GTP hydrolysis of wild-type and mutant Roc–COR proteins, measured with charcoal assay using 1 μM protein and 10 μM GTP at 15 °C. The following initial rates could be determined: wt, 3.3 × 10⁻²; Y558A, 1.2 × 10⁻³; Y804C, 4.0 × 10⁻³; L487V, 2.7 × 10⁻³; and L487A, 8.0 × 10⁻⁴ min−1.
Figure 7
Figure 7
Dimerisation and GTPase activity. (A, B) Ribbon diagram of the full Roc–COR model, highlighting juxtaposition of the G-domains, in particular the position of Arg543 close to γ-phosphate of the neighbouring protomer. GppNHp was modelled into the structure by superimposition with Ras-GppNHp (PDB 5P21). Owing to the absence of side-chain density, Arg543 residue was modelled into the most favourable rotamer conformation. (C) The GTPase activities of wt Roc–COR, the R543A and Roc–COR-ΔC mutants, measured as described in Figure 6C.

References

    1. Barbacid M (1987) ras Genes. Ann Rev Biochem 56: 779–827 - PubMed
    1. Bosgraaf L, Van Haastert PJM (2003) Roc, a Ras/GTPase domain in complex proteins. Biochim Biophys Acta—Mol Cell Res 1643: 5–10 - PubMed
    1. Chavas LMG, Torii S, Kamikubo H, Kawasaki M, Ihara K, Kato R, Kataoka M, Izumi T, Wakatsuki S (2007) Structure of the small GTPase Rab27b shows an unexpected swapped dimer. Acta Crystallogr Sec D BiolCrystallogr 63: 769–779 - PubMed
    1. Deng J, Lewis PA, Greggio E, Sluch E, Beilina A, Cookson MR (2008) Structure of the ROC domain from the Parkinson's disease-associated leucine-rich repeat kinase 2 reveals a dimeric GTPase. PNAS 105: 1499–1504 - PMC - PubMed
    1. Eberth A, Dvorsky R, Becker CFW, Beste A, Goody RS, Ahmadian MR (2005) Monitoring the real-time kinetics of the hydrolysis reaction of guanine nucleotide-binding proteins. Biol Chem 386: 1105–1114 - PubMed

MeSH terms

Substances