. 2008 Jul 18;4(7):e1000128.
doi: 10.1371/journal.pgen.1000128.

Dynamics of genome rearrangement in bacterial populations

Affiliations

Dynamics of genome rearrangement in bacterial populations

Aaron E Darling et al. PLoS Genet. .

Abstract

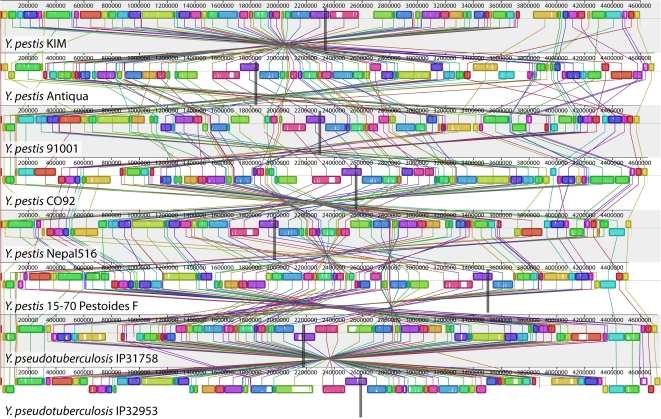
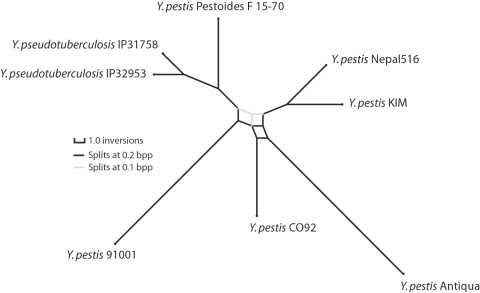
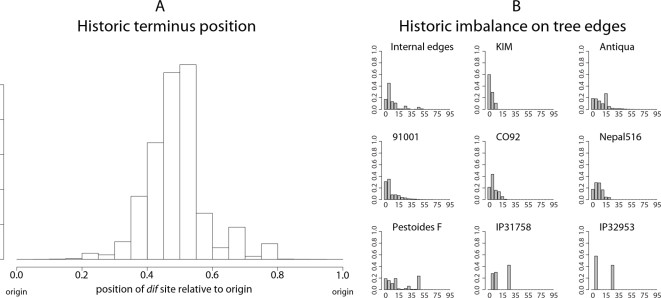
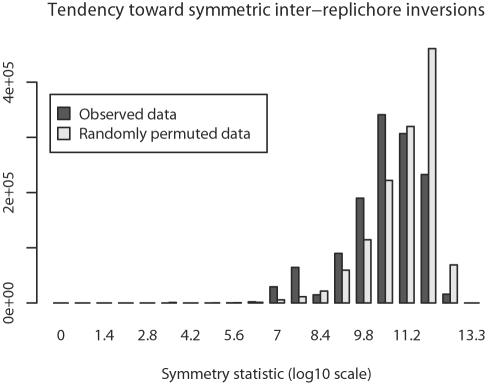
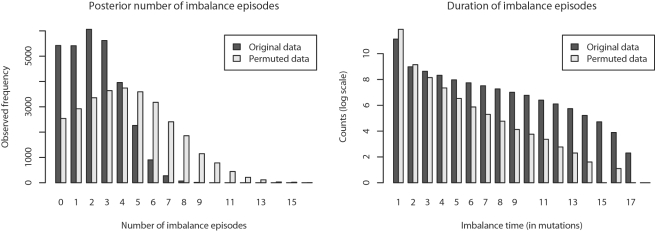
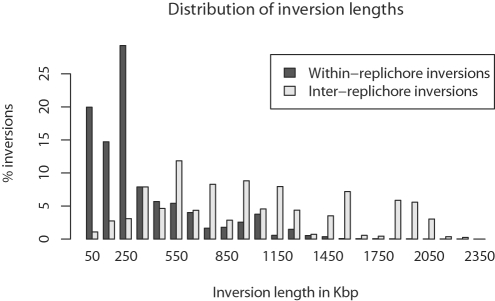
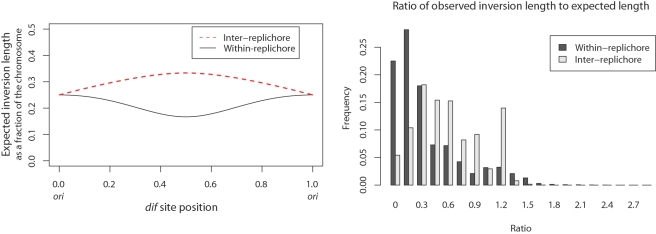
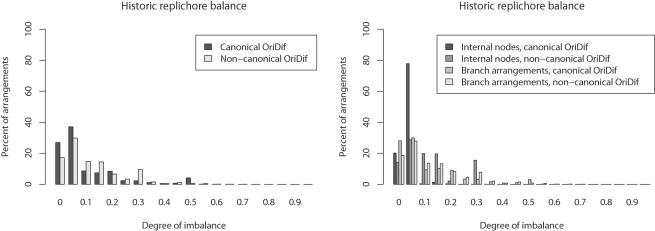
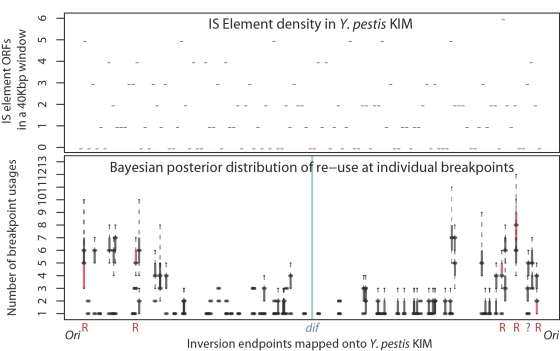
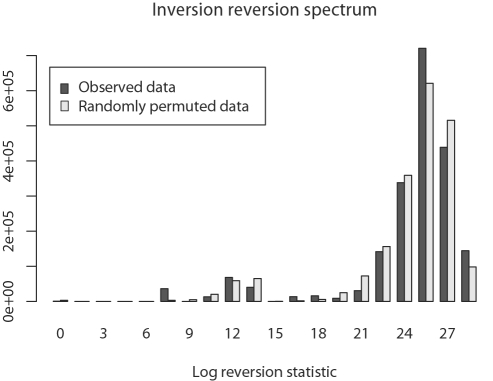
Genome structure variation has profound impacts on phenotype in organisms ranging from microbes to humans, yet little is known about how natural selection acts on genome arrangement. Pathogenic bacteria such as Yersinia pestis, which causes bubonic and pneumonic plague, often exhibit a high degree of genomic rearrangement. The recent availability of several Yersinia genomes offers an unprecedented opportunity to study the evolution of genome structure and arrangement. We introduce a set of statistical methods to study patterns of rearrangement in circular chromosomes and apply them to the Yersinia. We constructed a multiple alignment of eight Yersinia genomes using Mauve software to identify 78 conserved segments that are internally free from genome rearrangement. Based on the alignment, we applied Bayesian statistical methods to infer the phylogenetic inversion history of Yersinia. The sampling of genome arrangement reconstructions contains seven parsimonious tree topologies, each having different histories of 79 inversions. Topologies with a greater number of inversions also exist, but were sampled less frequently. The inversion phylogenies agree with results suggested by SNP patterns. We then analyzed reconstructed inversion histories to identify patterns of rearrangement. We confirm an over-representation of "symmetric inversions"-inversions with endpoints that are equally distant from the origin of chromosomal replication. Ancestral genome arrangements demonstrate moderate preference for replichore balance in Yersinia. We found that all inversions are shorter than expected under a neutral model, whereas inversions acting within a single replichore are much shorter than expected. We also found evidence for a canonical configuration of the origin and terminus of replication. Finally, breakpoint reuse analysis reveals that inversions with endpoints proximal to the origin of DNA replication are nearly three times more frequent. Our findings represent the first characterization of genome arrangement evolution in a bacterial population evolving outside laboratory conditions. Insight into the process of genomic rearrangement may further the understanding of pathogen population dynamics and selection on the architecture of circular bacterial chromosomes.


Conflict of interest statement

The authors have declared that no competing interests exist.

Figures

Figure 1
Figure 1. A genome alignment of eight Yersinia isolates.
Whole genome alignment of eight Yersinia genomes using Mauve reveals 78 locally collinear blocks conserved among all eight taxa. Each chromosome has been laid out horizontally and homologous blocks in each genome are shown as identically colored regions linked across genomes. Regions that are inverted relative to Y. pestis KIM are shifted below a genome's center axis. The origin of replication in each genome is approximately at coordinate 1 and the terminus dif sites are approximately midway through each genome, as marked by grey vertical bars. The termini were identified by sequence comparison with Y. pestis KIM, where they were characterized by extensive sequence analysis . Figure generated by Mauve, free/open-source software available from http://gel.ahabs.wisc.edu/mauve.
Figure 2
Figure 2. Lengths of Locally Collinear Blocks shared by the eight Yersinia genomes.
Block lengths are taken from the Y. pestis KIM reference genome.
Figure 3
Figure 3. Consensus phylogenetic network of Yersinia based on inversions.
Consensus phylogenetic network for eight of the Yersinia listed in Table 1. Branch lengths are proportional to the average number of per-branch inversion events. Splits with Bayesian posterior probability (Bpp)>0.2 are shown in black, splits with Bpp between 0.1 and 0.2 in gray. To visualize the network at Bpp 0.2, imagine removing gray edges and straightening the black edges. The inversion phylogeny supports a Y. pestis clade, and at Bpp 0.2 it supports subclades which agree with SNP phylogenies . Of note, internal branches in the Y. pestis are short relative to Y. pseudotuberculosis, suggesting either rapid population growth, subdivision, or other effects. Network visualization created using SplitsTree 4 .
Figure 4
Figure 4. Historic replichore balance in Yersinia.
Historic position of terminus dif site relative to origin (A) and historic degree of imbalance (B) observed in all sampled ancestral genome arrangements of the eight Yersinia listed in Table 1. The histogram in (A) shows the replichore balance of all sampled ancestral and extant genome arrangements of the Yersinia. In (A) an arrangement with equal replichore size will have a terminus at position 0.5, indicating perfect replichore balance. The diagram shows that >88% of sampled genome arrangements have replichores within 30% of perfect balance. (B): Histograms showing the degree of imbalance for arrangements sampled on branches leading to modern genomes. Each histogram is labeled with the corresponding strain's name. Genomes with perfectly balanced replichores have 0% imbalance while a genome with the origin and terminus at the same locus would have 100% imbalance. Many, but not all, parsimonious inversion histories have imbalanced genome arrangements at common ancestors of Y. pseudotuberculosis and Y. pestis Pestoides F that contribute toward the observed imbalance in the posterior distribution for those taxa.
Figure 5
Figure 5. Inter-replichore inversions exhibit symmetry.
Inter-replichore inversions exhibit greater symmetry about the origin and terminus than expected under a null model. Symmetry for inter-replichore inversions has been quantified by Equation 1 and compared to a null distribution. The null distribution is created by applying the permutation statistic in Eqn 2 to each of the 30,000 sampled rearrangement histories. The pooled posterior samples and permutations are plotted here, statistical tests are done on a per sample basis.
Figure 6
Figure 6. Episodes of imbalance in Yersinia.
Left: The Bayesian posterior distribution of the number of imbalance episodes occurring entirely on branches of reconstructed inversion phylogenies, compared with permuted data. Right: Posterior distribution of the imbalance episode duration (in mutation events) observed on branches, compared with data permuted as described in the text. From the two plots we can conclude that transitions to imbalance are less frequent than expected under a null model, and that imbalance episodes last longer than expected under the null model.
Figure 7
Figure 7. The posterior distribution of inversion lengths in Yersinia.
Inversions have been classified as inter-replichore (those which span the origin) and within-replichore. The observed within-replichore inversions have a strong tendency to be short, whereas the inter-replichore inversions have a more uniform length distribution.
Figure 8
Figure 8. Inversions are shorter than expected.
Left: The expected length of within-replichore and inter-replichore inversions assuming that inversion endpoints are uniformly distributed. The expected length changes as a function of the positioning of the terminus dif site relative to the origin of replication. In general, within-replichore inversions are expected to be shorter than inter-replichore inversions. Right: The ratio of observed inversion length to expected length for all sampled within- and inter-replichore inversions. Both inter- and within-replichore inversions are shorter than expected, but within-replichore inversions are much more so than inter-replichore inversions.
Figure 9
Figure 9. Association between replichore balance and the relative orientation of ori and dif.
Left: Balance for canonical and non-canonical OriDif configurations. Right: Balance as a function of whether arrangements are at an internal node or along a branch. Arrangements at internal nodes of the phylogeny appear to be better balanced, but only when ori and dif are in the canonical orientation.
Figure 10
Figure 10. Hotspots of breakpoint re-use in Yersinia exist near the origin.
Top: Number of annotated IS element ORFs in non-overlapping 40 Kbp windows of the Y. pestis KIM genome. Bottom: Hotspots of breakpoint re-use in Yersinia. The 78 blocks have 156 endpoints. Posterior estimates of the number of times each endpoint has been used are plotted here, with block endpoints positioned according their location in the Y. pestis KIM genome. Endpoints within 1500 bp of a ribosomal operon in at least one of the eight genomes are colored red and marked by ‘R’, while endpoint regions containing an annotated IS element are colored black. Only one breakpoint region is free from IS elements and ribosomal genes in all genomes, as marked by ‘?’. Together, the top and bottom panels demonstrate that we rarely observe inversions with endpoints proximal to the terminus in Yersinia, despite the presence of numerous IS elements in that region.
Figure 11
Figure 11. Testing whether inversions are immediately reverted by a second inversion with approximately identical endpoints.
Shown is the distribution of statistics described in Equation 6 for consecutive inversions in the posterior distribution of inversion histories (dark gray) and null expectation by randomly paired endpoint distances (light gray). If selection or a recombination bias favoring immediate reversion of imbalanced replichores explains the tendency towards balance, we would expect to see consecutive inversions sharing approximately equal endpoints more frequently than by chance alone. The difference between observation and null expectation is not significant (see text).
Figure 12
Figure 12. Calculating expected inversion length.
The expected length of within- and inter-replichore inversions can be calculated as integral averages of the function min{|xy|,1−|xy|} over the appropriate areas. Here, 0<b<1 is the terminus dif site. See the text for more details.

References

    1. Sousa C, de Lorenzo V, Cebolla A. Modulation of gene expression through chromosomal positioning in Escherichia coli. Microbiology. 1997;143 (Pt 6):2071–2078. - PubMed
    1. Couturier E, Rocha EP. Replication-associated gene dosage effects shape the genomes of fast-growing bacteria but only for transcription and translation genes. Molecular Microbiology. 2006;59:1506–1518. doi:10.1111/j.1365-2958.2006.05046.x. - PubMed
    1. Petkov PM, Graber JH, Churchill GA, DiPetrillo K, King BL, et al. Evidence of a large-scale functional organization of mammalian chromosomes. PLoS Genet 1. 2005 doi:10.1371/journal.pgen.0010033. - PMC - PubMed
    1. Sturtevant AH. Genetic factors affecting the strength of linkage in Drosophila. Proc Natl Acad Sci U S A. 1917;3:555–558. - PMC - PubMed
    1. Vetsigian K, Goldenfeld N. Global divergence of microbial genome sequences mediated by propagating fronts. Proc Natl Acad Sci U S A. 2005;102:7332–7337. doi:10.1073/pnas.0502757102. - PMC - PubMed

Publication types