. 2008 Aug;8(8):1265-72.
doi: 10.1039/b804911d. Epub 2008 Jul 4.

Detecting bacteria and determining their susceptibility to antibiotics by stochastic confinement in nanoliter droplets using plug-based microfluidics

Affiliations

Detecting bacteria and determining their susceptibility to antibiotics by stochastic confinement in nanoliter droplets using plug-based microfluidics

James Q Boedicker et al. Lab Chip. 2008 Aug.

Abstract

This article describes plug-based microfluidic technology that enables rapid detection and drug susceptibility screening of bacteria in samples, including complex biological matrices, without pre-incubation. Unlike conventional bacterial culture and detection methods, which rely on incubation of a sample to increase the concentration of bacteria to detectable levels, this method confines individual bacteria into droplets nanoliters in volume. When single cells are confined into plugs of small volume such that the loading is less than one bacterium per plug, the detection time is proportional to plug volume. Confinement increases cell density and allows released molecules to accumulate around the cell, eliminating the pre-incubation step and reducing the time required to detect the bacteria. We refer to this approach as 'stochastic confinement'. Using the microfluidic hybrid method, this technology was used to determine the antibiogram - or chart of antibiotic sensitivity - of methicillin-resistant Staphylococcus aureus (MRSA) to many antibiotics in a single experiment and to measure the minimal inhibitory concentration (MIC) of the drug cefoxitin (CFX) against this strain. In addition, this technology was used to distinguish between sensitive and resistant strains of S. aureus in samples of human blood plasma. High-throughput microfluidic techniques combined with single-cell measurements also enable multiple tests to be performed simultaneously on a single sample containing bacteria. This technology may provide a method of rapid and effective patient-specific treatment of bacterial infections and could be extended to a variety of applications that require multiple functional tests of bacterial samples on reduced timescales.


Figures

Fig. 1
Fig. 1
Stochastic confinement of bacteria into plugs reduces detection time. (a) Schematic drawing illustrates the increase in cell density resulting from the stochastic confinement of an individual bacterium in a nanoliter-sized plug. While most plugs are empty, a few are occupied by a single bacterium at an effective concentration greater than the initial concentration. (b) Schematic drawing illustrates the experimental procedure to compare the detection of bacteria incubated in nanoliter-sized plugs and bacteria incubated in a milliliter-scale culture. See text for details. Linescans indicate that confining the bacteria at the beginning of incubation (t = 0) led to a few occupied plugs with a high fluorescence intensity and many empty plugs with low fluorescence intensity (solid line). All plugs made from the milliliter-scale culture had an intermediate fluorescence intensity (dotted line). (c) When confining single bacteria into plugs, the detection time decreased with the log of the plug volume. (d) The detection times measured for bacteria incubated in plugs (○) were similar to detection times measured for bacteria incubated in 96-well plates (x) with similar initial cell densities.
Fig. 2
Fig. 2
A combination of stochastic confinement with the microfluidic hybrid method was used to screen many antibiotics against the same bacterial sample. (a) Schematic drawing illustrates the formation of plugs of bacteria, viability indicator, and antibiotic from a pre-formed array of plugs of different antibiotics. Approximately 50 plugs were formed with each antibiotic in the screen. (b) The increase in fluorescence intensity of the control plugs with no antibiotic (+, Blank1, positive control) and vancomycin (Δ, VCM, negative control) are shown. After incubation, four plugs contained live bacteria in the positive control sample, but no plugs contained live bacteria in the negative control sample treated with vancomycin, indicating that bacteria were not resistant to this antibiotic. (c) Bar graph shows the results of the antibiotic screen against the methicillin-resistant S. aureus (MRSA), indicating that this strain of MRSA was resistant to four antibiotics, but sensitive to two. The bars show the average increase in fluorescence intensity of all plugs that were above (solid) or below (striped) three times the intensity of the VCM baseline (see Experimental for details). N, shown above each bar, equals the number of plugs for each condition, and the error bars show the standard error. See ESI† for statistical analysis. (d) Chart shows the agreement between the susceptibility profiles (S, sensitive and R, resistant) of MRSA determined by the plug-based microfluidic screen and the control susceptibility screen using Mueller-Hinton plates. See text for details.
Fig. 3
Fig. 3
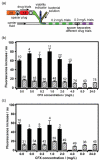
A microfluidic plug-based assay was used to identify the minimal inhibitory concentration (MIC) of cefoxitin (CFX) for methicillin-sensitive S. aureus (MSSA) and methacillin-resistant S. aureus (MRSA). (a) Schematic drawing illustrates the formation of plugs of bacteria, viability indicator, and an antibiotic at varying concentrations. In the schematic, numbers inside the pre-formed plugs symbolize the final concentration of CFX in those plugs. (b and c) Using 24 mg L-1 CFX as the baseline, graphs show the average change in fluorescence intensity of plugs greater than (solid) and less than (striped) three times the baseline for MRSA (b) and MSSA (c). N, shown above each bar, equals the number of plugs for each condition, and the error bars show the standard error. These results indicated that MRSA has a higher MIC than MSSA. See ESI† for statistical analysis.
Fig. 4
Fig. 4
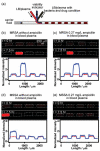
A combination of stochastic confinement with the plug-based microfluidic assay was used to determine susceptibility of bacteria to an antibiotic in a natural matrix, blood plasma. (a) Schematic drawing illustrates the formation of the plugs of bacteria, viability indicator, antibiotic, and the plasma/LB mixture. (b—e) Linescans indicate that fluorescence increases after 7.5 h (blue solid line) in the cases of no antibiotic or bacteria resistant to the antibiotic. (b and c) Images and linescans of four representative plugs made from a 1 : 1 blood plasma/LB sample inoculated with MRSA without (left) and with (right) the addition of ampicillin (AMP). (d and e) Images and linescans of four representative plugs made from a 1 : 1 blood plasma/LB sample inoculated with MSSA without (left) and with (right) the addition of AMP. Linescans show a change in fluorescence intensity across width of the images for plugs at t = 0 (red dashed line) and t = 7.5 h (solid blue line). The scale bar in (b) applies to all images. All images were contrast-enhanced for clarity and should be interpreted qualitatively; linescans of raw intensities are provided to convey the information quantitatively.

References

    1. Martin GS, Mannino DM, Eaton S, Moss M. New Engl. J. Med. 2003;348:1546–1554. - PubMed
    1. Farr BM. Curr. Opin. Infect. Dis. 2004;17:317–322. - PubMed
    1. Moran GJ, Krishnadasan A, Gorwitz RJ, Fosheim GE, McDougal LK, Carey RB, Talan DA. New Engl. J. Med. 2006;355:666–674. - PubMed
    1. Carrigan SD, Scott G, Tabrizian M. Clin. Chem. (Washington, D. C.) 2004;50:1301–1314. - PubMed
    1. Nguyen HB, Rivers EP, Abrahamian FM, Moran GJ, Abraham E, Trzeciak S, Huang DT, Osborn T, Stevens D, Talan DA. Ann. Emerg. Med. 2006;48:28–54. - PubMed

Publication types

MeSH terms

Substances