

Epochal changes in the association between malaria epidemics and El Niño in Sri Lanka
- PMID: 18652697
- PMCID: PMC2525655
- DOI: 10.1186/1475-2875-7-140
Epochal changes in the association between malaria epidemics and El Niño in Sri Lanka
Abstract
Background: El Niño events were suggested as a potential predictor for malaria epidemics in Sri Lanka based on the coincidence of nine out of 16 epidemics with El Niño events from 1870 to 1945. Here the potential for the use of El Niño predictions to anticipate epidemics was examined using enhanced climatic and epidemiological data from 1870 to 2000.
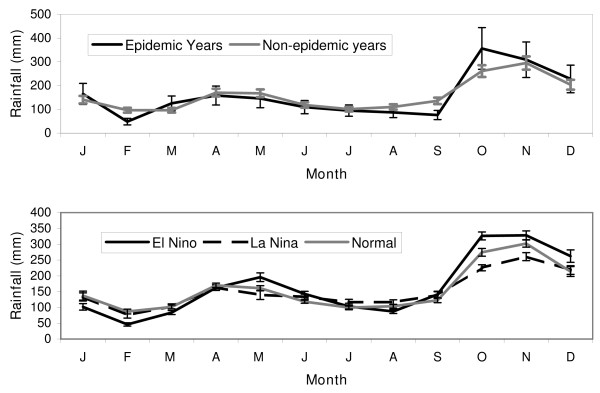
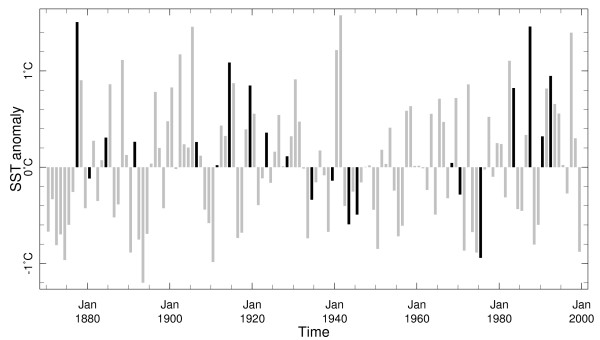
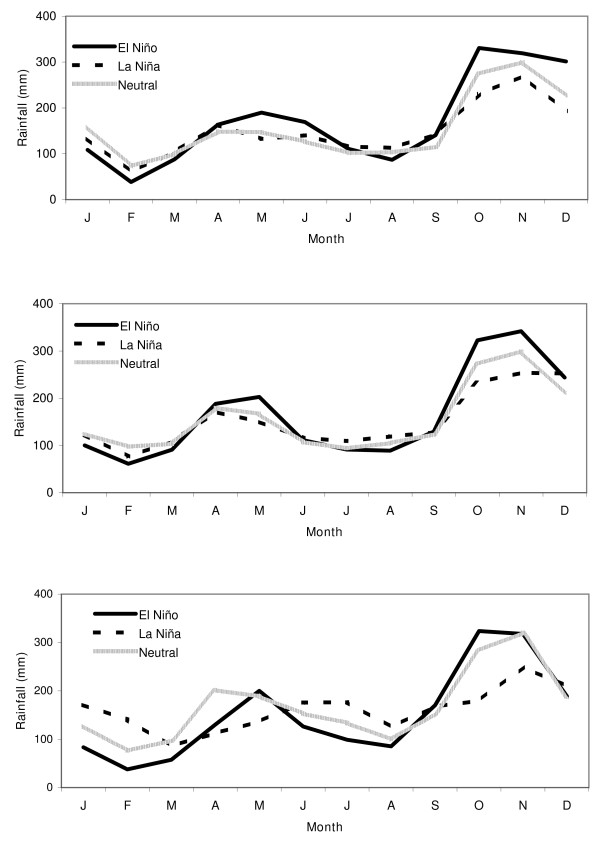
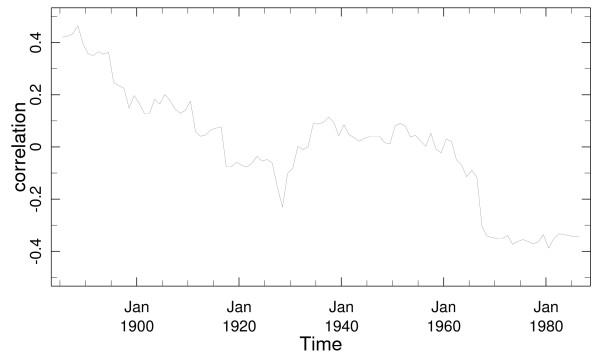
Methods: The epidemics start years were identified by the National Malaria Control Programme and verified against epidemiological records for consistency. Monthly average rainfall climatologies were estimated for epidemic and non-epidemic years; as well El Niño, Neutral and La Niña climatic phases. The relationship between El Niño indices and epidemics was examined to identify 'epochs' of consistent association. The statistical significance of the association between El Niño and epidemics for different epochs was characterized. The changes in the rainfall-El Niño relationships over the decade were examined using running windowed correlations. The anomalies in rainfall climatology during El Niño events for different epochs were compared.
Results: The relationship between El Niño and epidemics from 1870 to 1927 was confirmed. The anomalies in monthly average rainfall during El Niño events resembled the anomalies in monthly average rainfall during epidemics during this period. However, the relationship between El Niño and epidemics broke down from 1928 to 1980. Of the three epidemics in these six decades, only one coincided with an El Niño. Not only did this relationship breakdown but epidemics were more likely to occur in periods with a La Niña tendency. After 1980, three of four epidemics coincided with El Niño.
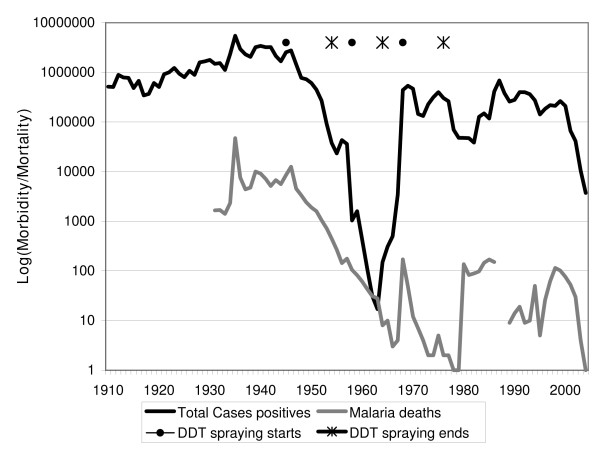
Conclusion: The breakdown of the association between El Niño and epidemics after 1928 is likely due to an epochal change in the El Niño-rainfall relationship in Sri Lanka around the 1930's. It is unlikely that this breakdown is due to the insecticide spraying programme that began in 1945 since the breakdown started in 1928. Nor does it explain the occurrence of epidemics during La Niña phase from 1928 to 1980. Although there has been renewed coincidence with El Niño after 1980, this record is too short for establishing a reliable relationship.
Figures
References
-
- Connor SJ, Thomson MC, Molyneux DH. Forecasting and prevention of epidemic malaria: new perspectives on an old problem. Parassitologia. 1999;41:439–448. - PubMed
-
- Casman E, Dowlatabadi H, Eds . The contextual determinants of malaria. Resources for the future press, Washington, DC; 2002.
-
- Matsuno Y, Konradsen F, Tasumi M, Hoek W Van Der, Amerasinghe FP, Amerasinghe PH. Control of malaria mosquito breeding through irrigation water management. Water Resources Development. 1999;15:93–105. doi: 10.1080/07900629948952. - DOI
-
- Najera JA. Malaria control: achievements, problems and strategies. Parassitologia. 2001;43:1–89. - PubMed
Publication types
MeSH terms
LinkOut - more resources
Full Text Sources
Medical
