Comparative Study
. 2008 Sep 21;254(2):439-51.
doi: 10.1016/j.jtbi.2008.05.031. Epub 2008 Jul 23.

Modeling amantadine treatment of influenza A virus in vitro

Affiliations
Comparative Study

Modeling amantadine treatment of influenza A virus in vitro

Catherine A A Beauchemin et al. J Theor Biol. .

Abstract

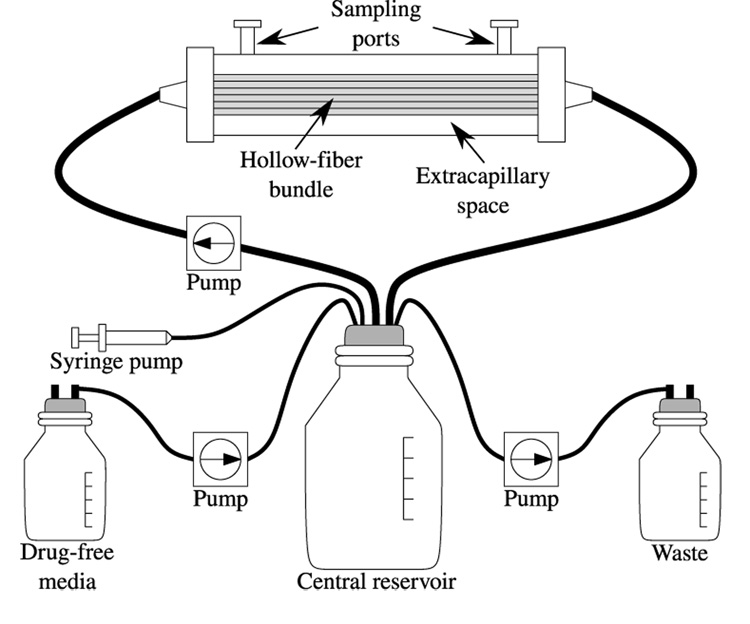
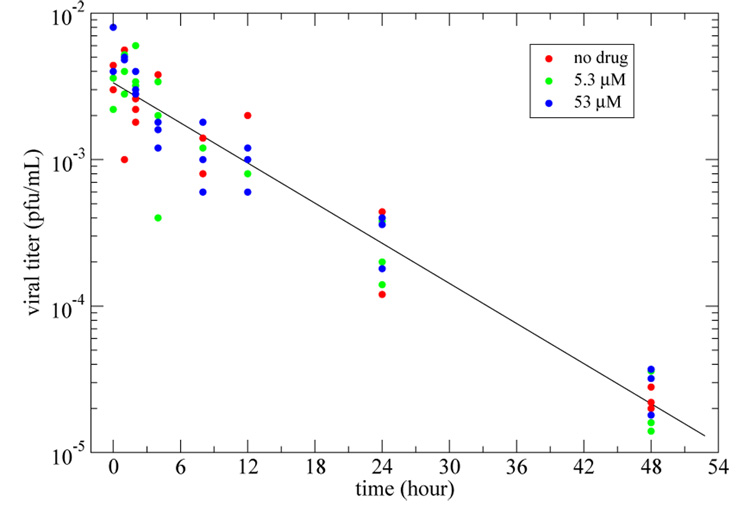
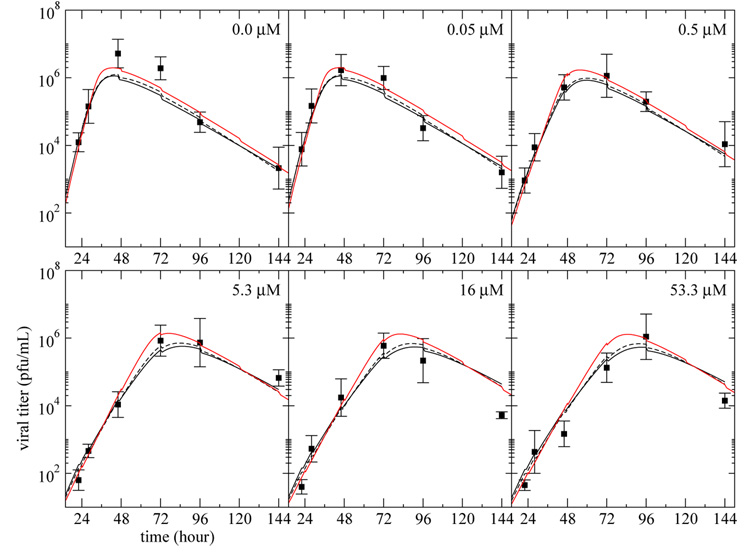
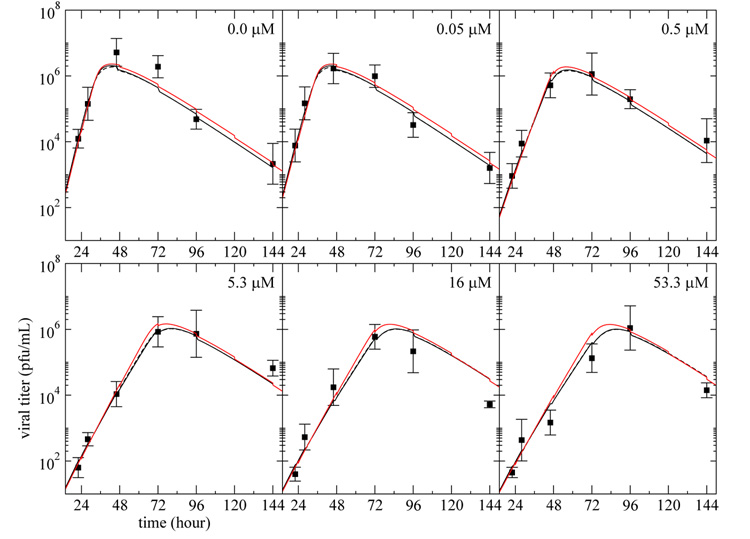
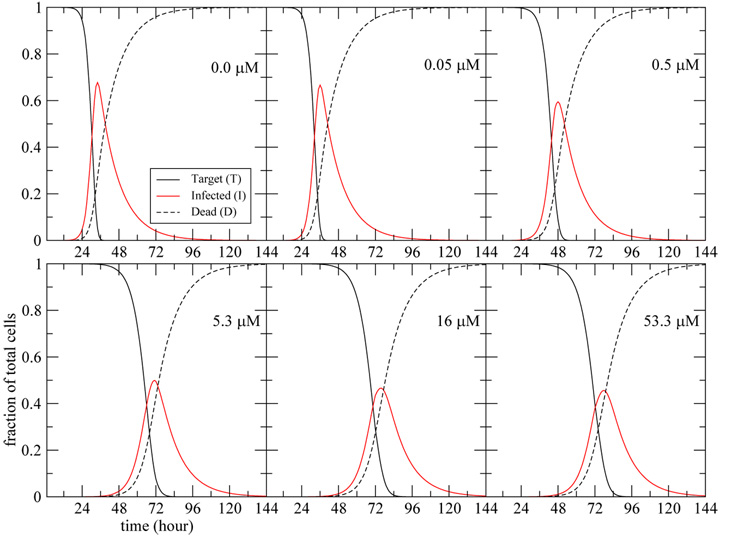
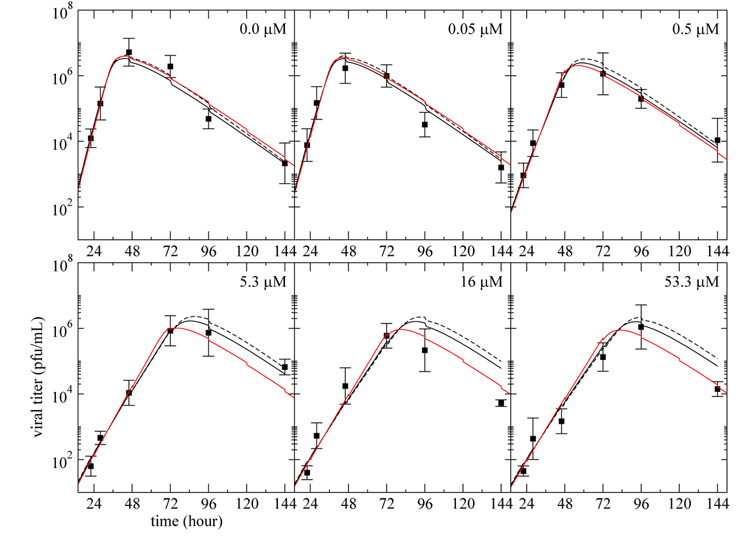
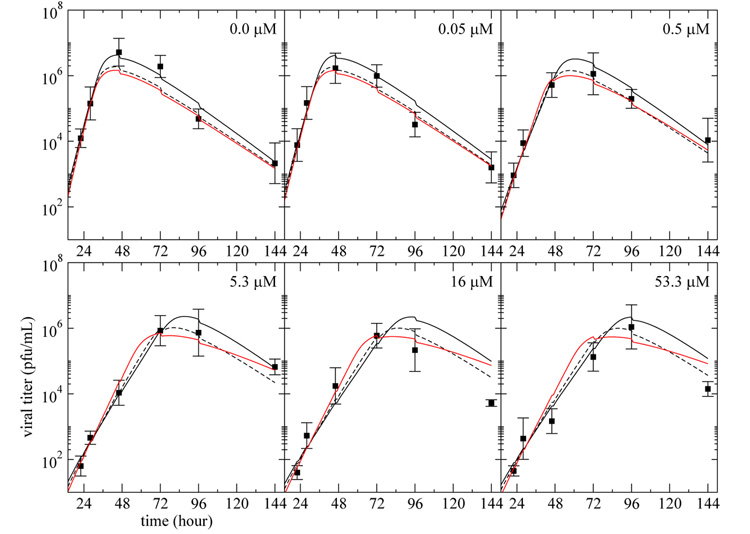
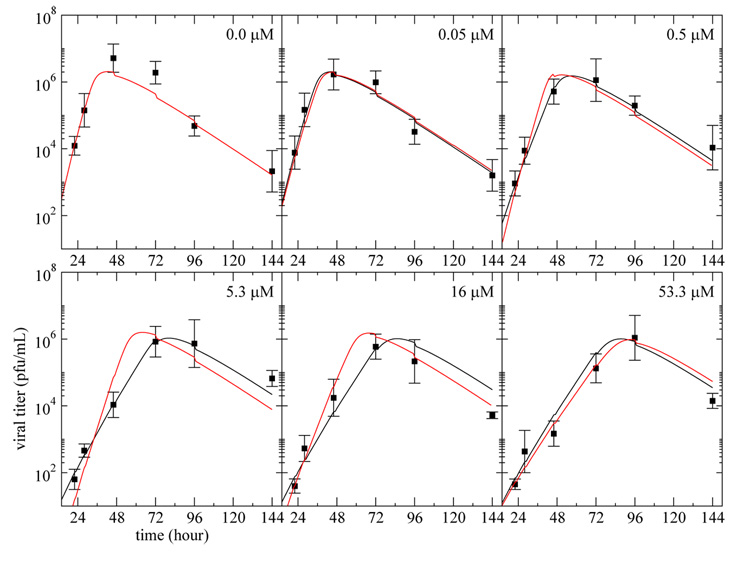
We analyzed the dynamics of an influenza A/Albany/1/98 (H3N2) viral infection, using a set of mathematical models highlighting the differences between in vivo and in vitro infection. For example, we found that including virion loss due to cell entry was critical for the in vitro model but not for the in vivo model. Experiments were performed on influenza virus-infected MDCK cells in vitro inside a hollow-fiber (HF) system, which was used to continuously deliver the drug amantadine. The HF system captures the dynamics of an influenza infection, and is a controlled environment for producing experimental data which lend themselves well to mathematical modeling. The parameter estimates obtained from fitting our mathematical models to the HF experimental data are consistent with those obtained earlier for a primary infection in a human model. We found that influenza A/Albany/1/98 (H3N2) virions under normal experimental conditions at 37 degrees C rapidly lose infectivity with a half-life of approximately 6.6+/-0.2 h, and that the lifespan of productively infected MDCK cells is approximately 13 h. Finally, using our models we estimated that the maximum efficacy of amantadine in blocking viral infection is approximately 74%, and showed that this low maximum efficacy is likely due to the rapid development of drug resistance.


Figures

Fig. 1
Fig. 1. Diagram of the hollow-fiber system
The HF system allows virus-infected cells to produce high titers of cell-free virus within the HF bundle. The extracapillary space (ECS) is separated from the medium coming from the central reservoir with pore sizes that are large enough to allow nutrients, small compounds, and cellular metabolites to traverse in and out of this ECS but too small for viruses and virus-infected cells to leave the ECS. The ECS can be sampled through the sampling ports to determine the number of virus-infected cells and the amount of cell-free virus in the HF unit over time.
Fig. 2
Fig. 2. Rate of loss of infectivity of influenza virions
A linear least square regression yielded a rate of loss of infectivity (slope of the best-fit line) of c = 0.105 ± 0.003 h−1. Since the presence of amantadine in various concentrations (red, green, blue) did not appear to affect the rate of loss of infectivity, data from all three experiments were combined as a single set for fitting.
Fig. 3
Fig. 3. Infectious viral titer predicted by the three models
The curves represent the best fit of the infectious viral titer, V , predicted by the simple model (solid), (1)–(3), eclipse model (dashed), (5)–(8), and delay model (red), (9)–(11), to the plaque assay data (square) from experiments performed on MDCK cells in the HF system at various drug dosages. The vertical bars on the experimental points indicate the standard deviation of the experimental measurements done in triplicate. Each panel corresponds to a different drug concentration — indicated in the top right corner — maintained constant over the full duration of the experiment. All the data were fitted simultaneously and the parameter values obtained are given in Table 1.
Fig. 4
Fig. 4. Infectious viral titer predicted by the three models with virion entry into cells
The curves represent the best fit of the infectious viral titer, V , predicted by the simple model (solid), eclipse model (dashed), and delay model (red), modified to include loss of virus due to cell entry as in Eqn. (13), to the plaque assay data (square) from experiments performed on MDCK cells in the HF system at various drug dosages. Each panel corresponds to a different drug dosage experiment where the drug is maintained at a constant concentration — indicated in the top right corner — over the full duration of the experiment. All the data were fitted simultaneously and the parameter values obtained are given in Table 2.
Fig. 5
Fig. 5. Prediction of the evolution of the cell populations over time
The populations of target, infected, and dead cells over the course of the infection are predicted using the simple model modified to include loss of virus due to cell entry as in Eqn. (13). The dead cells, D, are defined as dD/dt = δI, and the fraction of total cells are computed by dividing T, I, or D by (T + I + D) at each time point. Each panel corresponds to a different drug dosage experiment where the drug is maintained at a constant concentration — indicated in the top right corner — over the full duration of the experiment. The parameter values used are given in Table 2.
Fig. 6
Fig. 6. Infectious viral titer predicted by the three models with virion entry into cells and no multiple infection
The curves represent the best fit of the infectious viral titer, V , predicted by the simple model (solid), eclipse model (dashed), and delay model (red), modified to include loss of virus due to cell entry as per (13), and no multiple infection as per (15), to the plaque assay data (square) from experiments performed on MDCK cells in the HF system at various drug dosages. Each panel corresponds to a different drug dosage experiment where the drug is maintained at a constant concentration — indicated in the top right corner — over the full duration of the experiment. All the data were fitted simultaneously and the parameter values obtained are given in Table 4.
Fig. 7
Fig. 7. Infectious viral titer predicted by the eclipse model with virion entry into cells, with no multiple infection, or with the drug affecting the length of the eclipse phase
The curves represent the best fit of the infectious viral titer, V , predicted by the eclipse model with virion entry into cell (dashed), with no multiple infection (solid), or with the drug affecting the length of the eclipse phase (red), to the plaque assay data (square) from experiments performed on MDCK cells in the HF system at various drug dosages. Each panel corresponds to a different drug dosage experiment where the drug is maintained at a constant concentration — indicated in the top right corner — over the full duration of the experiment. All the data were fitted simultaneously and the parameter values obtained are given in Table 2 (dashed), Table 4 (solid), and Table 5 (red).
Fig. 8
Fig. 8. Effect of considering emergence of drug-resistance on viral titer predictions
The best fit of the viral titer data using the simple model with virion entry into cells, with and without considering the effect of the emergence of drug-resistant mutants on ϵmax are presented. The simple model using the parameters presented in Table 2 with ϵmax = 56% (black) is compared against the simple model using ϵmax = 95% and IC50 = 0.40 µM for t ≤ τµ and IC50 = 33 µM for t > τµ with τµ as in Table 6 (red). All other parameters are as in Table 2.

References

    1. Abed Y, Goyette N, Boivin G. Generation and characterization of recombinant inuenza A (H1N1) viruses harboring amantadine resistance mutations. Antimicrob. Agents Chemother. 2005 February;42(2):556–559. - PMC - PubMed
    1. Baccam P, Beauchemin C, Macken CA, Hayden FG, Perelson AS. Kinetics of inuenza A virus infection in humans. J. Virol. 2006 August;80(15):7590–7599. - PMC - PubMed
    1. Belshe RB, Smith MH, Hall CB, Betts R, Hay AJ. Genetic basis of resistance to rimantadine emerging during treatment of inuenza virus infection. J. Virol. 1988 May;62(5):1508–1512. - PMC - PubMed
    1. Bilello JA, Bauer G, Dudley MN, Cole GA, Drusano GL. Effect of 2’,3’-didehydro-3’-deoxythymidine in an in vitro hollow-fiber pharmacodynamic model system correlates with results of dose-ranging clinical studies. Antimicrob. Agents Chemother. 1994 June;38(6):1386–1391. - PMC - PubMed
    1. Bocharov GA, Romanyukha AA. Mathematical model of antiviral immune response III. Inuenza A virus infection. J. Theor. Biol. 1994;167(4):323–360. - PubMed

Publication types