Review
. 2008 Jul;27(4):331-71.
doi: 10.1016/j.preteyeres.2008.05.001. Epub 2008 May 28.

Vascular endothelial growth factor in eye disease

Affiliations
Review

Vascular endothelial growth factor in eye disease

J S Penn et al. Prog Retin Eye Res. 2008 Jul.

Abstract

Collectively, angiogenic ocular conditions represent the leading cause of irreversible vision loss in developed countries. In the US, for example, retinopathy of prematurity, diabetic retinopathy and age-related macular degeneration are the principal causes of blindness in the infant, working age and elderly populations, respectively. Evidence suggests that vascular endothelial growth factor (VEGF), a 40kDa dimeric glycoprotein, promotes angiogenesis in each of these conditions, making it a highly significant therapeutic target. However, VEGF is pleiotropic, affecting a broad spectrum of endothelial, neuronal and glial behaviors, and confounding the validity of anti-VEGF strategies, particularly under chronic disease conditions. In fact, among other functions VEGF can influence cell proliferation, cell migration, proteolysis, cell survival and vessel permeability in a wide variety of biological contexts. This article will describe the roles played by VEGF in the pathogenesis of retinopathy of prematurity, diabetic retinopathy and age-related macular degeneration. The potential disadvantages of inhibiting VEGF will be discussed, as will the rationales for targeting other VEGF-related modulators of angiogenesis.


Figures

Figure 1
Figure 1
A) Associations of various VEGF isoforms with VEGF receptors and co-receptors and basic receptor structure. B) Variants of VEGF-A are formed by alternative splicing. Exons 1 – 5 span the receptor binding domain, while exons 6 and 7 span the heparin binding domain.
Figure 2
Figure 2
VEGFR-2 signaling pathways leading to endothelial cell activities designated in red.
Figure 3
Figure 3
In normoxia, pVHL binds a hydroxylated proline residue of HIF-1α, leading to ubiquitin attachment and degradation in the proteasome. In hypoxia, constitutively expressed HIF-1α dimerizes with HIF-1β and leads to transcription of hypoxia-inducible genes, including VEGF.
Figure 4
Figure 4
Mouse model of retinal vascularization and OIR showing the temporal and spatial relationships between astrocyte growth, VEGF production and blood vessel development (Republished with permission of the University of the Basque Country Press from Saint-Geniez M, D’Amore PA. Development and pathology of the hyaloid, choroidal and retinal vasculature. Int J Dev Biol 2004; 48:1045–58).
Figure 5
Figure 5
Vascular networks in the retina are depicted by fluorescein-labeled lectin staining in retinal whole mount preparations (A, C) and in a schematic of a retinal cross-section (B). Images in A and C were taken at different focal planes and colored red (primary plexus), green (inner deeper plexus) and blue (outer deeper plexus), and superimposed using a computer. At P8 (A) sprouts (yellow) are emerging from veins (v) and capillaries but not arteries (a). At P14 (C) all three networks are established. Arrowheads indicate connections between the primary and the inner deeper plexus. Arrows indicate connections between the inner and outer deeper plexus (RGC, retinal ganglion cells; IPL, inner plexiform layer; INL, inner nuclear layer; OPL, outer plexiform layer; ONL, outer nuclear layer; RPE, retinal pigment epithelium). Scale bars are 100 μm. Adapted from Fruttiger, 2007.
Figure 6
Figure 6
P6 mice were exposed to 20% (A), 40% (B) or 80% (C) oxygen for 36 hours. Retinas were subsequently processed for in situ hybridization with a probe against mouse VEGF mRNA which is pseudo-colored red, while vessels were visualized with an antibody against mouse collagen type IV which is pseudo-colored green. Capillary-free zones around the optic nerve head (dotted yellow lines) and around retinal arteries (arrows) expand with increasing oxygen concentrations. Adapted from Claxton and Fruttiger, 2003.
Figure 7
Figure 7
Flat-mounted retina from P13 mouse (after 75% O2 from P7 - P12) stained with anti collagen type IV (vessels in green) and anti EF5 (red, hypoxic areas). The animal was injected with the drug EF5 two hours before sacrifice. In hypoxic regions, the drug is reduced and forms permanent protein adducts that can be recognized with an antibody. (Unpublished, courtesy of Marcus Fruttiger).
Figure 8
Figure 8
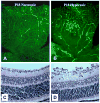
Panels illustrate retinal neovascularization in the mouse OIR model. Fluorescein-infused retinal flat-mounts (A, B) and H&E-stained transverse sections (C, D) of retinas from P18 mice raised in room air (A, C) or treated with hyperoxia between P7 and P12 (B, D). Neovascular tufts can be observed in the retinal mid-periphery at the boundary between vascular and avascular retinal regions.
Figure 9
Figure 9
Panels illustrate retinal neovascularization in the rat OIR model. Fluorescein-infused retinal flat-mounts from room air (A) and OIR (B) treatments show vaso-attenuation of the retinal periphery in the latter. After a brief post-oxygen exposure period in room air, neovascular tufts arise in the mid-periphery as illustrated in ADPase-stained retinal flat mounts (C).
Figure 10
Figure 10
High glucose treatment of EC leads to superoxide formation, an increase in intracellular calcium and activation of endothelial NOS (NOS3) to form NO, but it also causes NOS3 “uncoupling” to generate superoxide and NO.
Figure 11
Figure 11
Numerous factors can contribute to VEGF over-expression in diabetic retinopathy (ROS, reactive oxygen species; RNS, reactive nitrogen species).
Figure 12
Figure 12
Proposed role of STAT3 in oxidative stress-induced upregulation of VEGF. Oxidative stress can activate STAT3 by phosphorylation of tyrosine 705 within the activation domain. STAT3 activation may lead to VEGF production in response to both inflammatory and hypoxic stimuli.
Figure 13
Figure 13
VEGF stimulation causes a transient increase in transcellular electrical resistance (TER) across the retinal endothelial cell monolayer, which is followed by a gradual decline in TER. The TER increase is associated with a rapid, but transient increase in flux of horseradish peroxidase (HRP), which is followed by a transient recovery of the barrier function and a delayed, but sustained, increase in tracer flux.
Figure 14
Figure 14
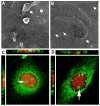
Retinal endothelial cells exhibit very few plasma membrane caveolae (arrow in A). VEGF treatment induces a significant increase in caveolae formation (arrows in B) and promotes the nuclear translocation of VEGFR2 (C, green label) and NOS3 (D, green label).
Figure 15
Figure 15
β-catenin is localized to cell-cell junctions in untreated retinal endothelial cells (A), but redistributes to the cytosol and nucleus upon VEGF stimulation (B).
Figure 16
Figure 16
Expression of uPAR initiates the uPA-mediated proteolytic cascade. MMP activity is associated with ECM degradation, increased vessel permeability and growth factor liberation, all of which promote diabetic vascular pathology.
Figure 17
Figure 17
A schematic representation of the proposed mechanism by which high glucose, via its effect on peroxynitrite, inactivates the VEGF/PI3K/Akt-1 pro-survival pathway and stimulates cell death via activation of p38 MAP kinase pathway. Nitration of PI3K is proposed as a mechanism by which high glucose switches off the VEGF pro-survival pathway and triggers the pro-apoptotic pathway.
Figure 18
Figure 18
Diagram illustrating the hypothesis linking VEGF expression, genetic predisposition and changes in the RPE/Bruch’s membrane/choroid region with increasing age leading to neovascular AMD and culminating in neurosensory retinal CNV and vision loss.
Figure 19
Figure 19
Figure 19A. Red-free (left) and laminar phase fluorescein angiograms (right) demonstrating retinal vascular abnormalities/anomalous complexes (RVACs; arrows), in which retinovascular circulation feeds deep intra- or subretinal neovascular complexes. There is a pigment epithelial detachment best noted on the red-free image and exudation temporally. Figure 19B. Mid-phase (left) and later phase (right) fluorescein angiograms of mainly classic (neurosensory retinal) CNV. Figure 19C. Mid-phase (left) and late frame (right) fluorescein angiograms of predominantly occult CNV. There are several hyperfluorescent areas (example, arrow) in late frames showing possible “breakthrough” of CNV into the neurosensory retina.
Figure 19
Figure 19
Figure 19A. Red-free (left) and laminar phase fluorescein angiograms (right) demonstrating retinal vascular abnormalities/anomalous complexes (RVACs; arrows), in which retinovascular circulation feeds deep intra- or subretinal neovascular complexes. There is a pigment epithelial detachment best noted on the red-free image and exudation temporally. Figure 19B. Mid-phase (left) and later phase (right) fluorescein angiograms of mainly classic (neurosensory retinal) CNV. Figure 19C. Mid-phase (left) and late frame (right) fluorescein angiograms of predominantly occult CNV. There are several hyperfluorescent areas (example, arrow) in late frames showing possible “breakthrough” of CNV into the neurosensory retina.
Figure 20
Figure 20
Figure 20A. Co-culture of bovine retinal microvascular EC and bovine RPE increased the secretion of soluble VEGF into medium (* - p = 0.008; ** - p < 0.05; one-way ANOVA). B. Co-culture of EC and RPE reduced transepithelial electrical resistance (TER) of RPE through soluble VEGF. Neutralizing antibody to VEGF partially restored TER of RPE in co-culture conditions (* - p < 0.001; ** - p < 0.03; two-way factorial ANOVA).
Figure 21
Figure 21
CECs transmigrate across RPE cells (ARPE-19) over time (white bars). Administation of a neutralizing antibody to VEGF decreases CEC transmigration across ARPE-19 (black bars) (200 ng/mL neutralizing antibody to VEGF; * - p = 0.005; Student’s t-Test).
Figure 22
Figure 22
Enhanced CEC transmigration is observed specifically when cultured in contact with RPE (ARPE-19) and not generally when cultured with a fibroblast cell line (Balb) or fibroblast ECM (Balb-ECM).
Figure 23
Figure 23
Contact between RPE and CECs triggers a PI3K-dependent activation of Rac1 in CECs necessary for their transmigration toward the VEGF gradient in the neurosensory retina. VEGF in the neurosensory retina provides a chemotactic gradient for further migration of CECs resulting in “breakthrough” regions on fluorescein angiography, which represent well-defined and sight-threatening CNV.
Figure 24
Figure 24
VEGF did not increase CEC proliferation in vitro, however RPE-CEC co-culture-conditioned medium did. Neutralizing antibody to VEGF did not inhibit CEC proliferation caused by conditioned medium (ANOVA - p = 0.001; * - p = 0.034; ** - p = 0.001; *** - p = 0.015; § - p = 0.009; Student’s t-Test with Bonferroni correction, n = at least 9).

Similar articles

Cited by

References

    1. Abu El-Asrar AM, Meersschaert A, et al. Inducible nitric oxide synthase and vascular endothelial growth factor are colocalized in the retinas of human subjects with diabetes. Eye. 2004;18:306–313. - PubMed
    1. Adamis AP, Miller JW, et al. Increased vascular endothelial growth factor levels in the vitreous of eyes with proliferative diabetic retinopathy. Am J Ophthalmol. 1994;118:445–450. - PubMed
    1. Adamis AP, Shima DT, et al. Synthesis and secretion of vascular permeability factor/vascular endothelial growth factor by human retinal pigment epithelial cells. Biochem Biophys Res Commun. 1993;193:631–638. - PubMed
    1. Adamis AP, Shima DT, et al. Inhibition of vascular endothelial growth factor prevents retinal ischemia-associated iris neovascularization in a nonhuman primate. Arch Ophthalmol. 1996;114:66–71. - PubMed
    1. Age-Related Eye Disease Study Research Group. A randomized, placebo-controlled, clinical trial of high-dose supplementation with vitamins C and E, beta carotene, and zinc for age-related macular degeneration and vision loss: AREDS Report No. 8. Arch Ophthalmol. 2001;119:1417–1436. - PMC - PubMed

Publication types

MeSH terms

Substances