. 2008 Sep;36(15):4823-32.
doi: 10.1093/nar/gkn463. Epub 2008 Jul 24.

Tissue-specific splicing factor gene expression signatures

Affiliations

Tissue-specific splicing factor gene expression signatures

Ana Rita Grosso et al. Nucleic Acids Res. 2008 Sep.

Abstract

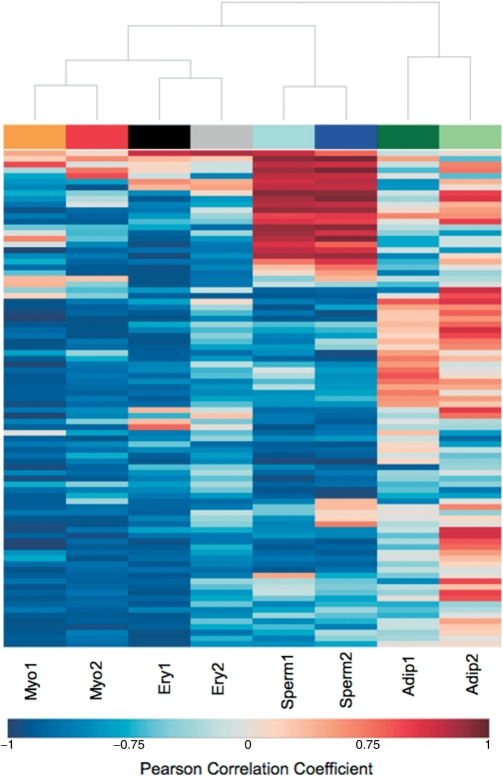
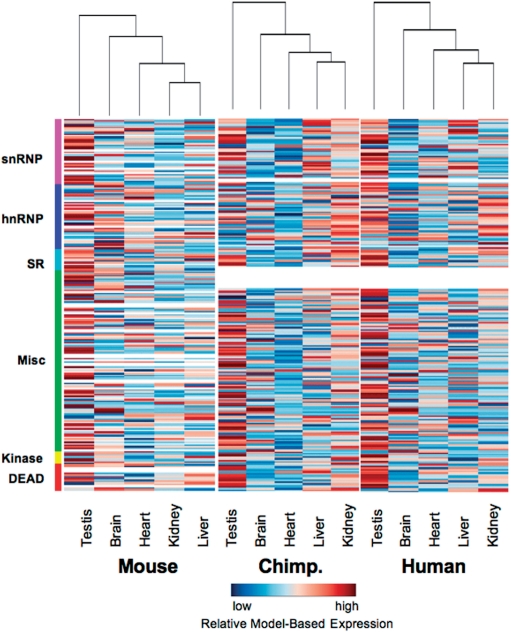
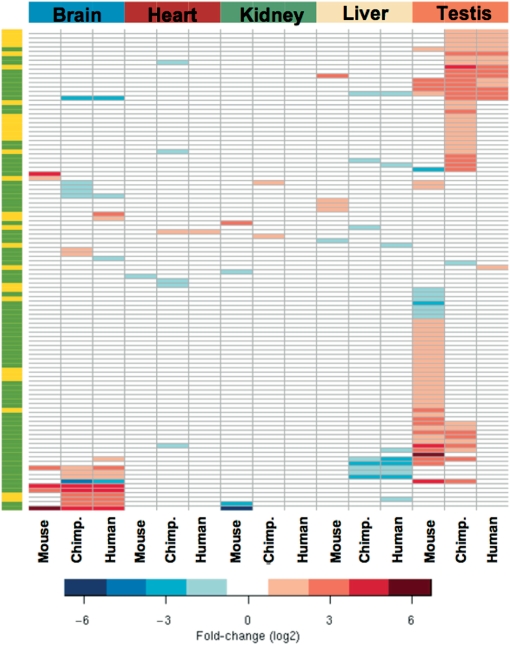
The alternative splicing code that controls and coordinates the transcriptome in complex multicellular organisms remains poorly understood. It has long been argued that regulation of alternative splicing relies on combinatorial interactions between multiple proteins, and that tissue-specific splicing decisions most likely result from differences in the concentration and/or activity of these proteins. However, large-scale data to systematically address this issue have just recently started to become available. Here we show that splicing factor gene expression signatures can be identified that reflect cell type and tissue-specific patterns of alternative splicing. We used a computational approach to analyze microarray-based gene expression profiles of splicing factors from mouse, chimpanzee and human tissues. Our results show that brain and testis, the two tissues with highest levels of alternative splicing events, have the largest number of splicing factor genes that are most highly differentially expressed. We further identified SR protein kinases and small nuclear ribonucleoprotein particle (snRNP) proteins among the splicing factor genes that are most highly differentially expressed in a particular tissue. These results indicate the power of generating signature-based predictions as an initial computational approach into a global view of tissue-specific alternative splicing regulation.


Figures

Figure 1.
Figure 1.
Variation in expression of splicing-related genes during cell differentiation. Hierarchical clustering display of Pearson correlation values between gene expression and time, for the splicing-related genes with the absolute correlation values >0.75 in both data sets of at least one differentiation process. The negative and positive correlation values are represented by blue and red colors, respectively.
Figure 2.
Figure 2.
Validation of microarray data analysis by quantitative real-time PCR. The fold-changes in expression of 27 splicing factors at T1 and T2 relative to T0 are indicated. For qRT-PCR analysis, RNA samples were obtained from C2 myoblasts and fetal liver erythroid progenitors. Results are presented as means for at least three independent experiments. Results from microarray data sets are presented as the fold-changes estimated from the linear models. The dashed lines indicate the 1.5-fold-change values (in logarithm scale) for microarray data and qRT-PCR. The differentially expressed genes selected by microarray data analysis for each differentiation stage are indicated with solid circles.
Figure 3.
Figure 3.
Splicing-related gene expression signatures during cell differentiation. Heatmap with the fold-changes (log2) observed for each gene that is most highly differentially expressed during myotube (Myo), adipocyte (Adip), sperm cell (Sperm) and erythrocyte (Ery) differentiation. The genes and respective fold-changes are presented in detail in Supplementary Table 5. The side colors represent the splicing-related genes (yellow) and the specific differentiation marker genes for myogenesis (Ryr1, Tnnc1 in blue), adipogenesis (Pparg and Cfd in red), spermatogenesis (Ldhc, Pgk2 in green) and erythropoiesis (Gypa and Slc4a1 in gray).
Figure 4.
Figure 4.
Tissue expression profiles of splicing-related genes are similar in human, chimpanzee and mouse. Heatmap of adult mouse, chimpanzee and human tissues using microarray-derived expression profiles of splicing-related genes. The expression value for each gene is normalized across the samples to zero mean and 1SD for visualization purposes. Genes with expression levels greater than the mean are colored in red and those below the mean are colored in blue. The expression values for genes that are not present in one of the microarray platforms are represented by white.
Figure 5.
Figure 5.
Tissue-specific splicing-related gene expression signatures. Heatmap indicating the fold-changes (log2) observed for each gene that is most highly differentially expressed in the five tissues examined. The left bar highlights genes that are present in both human and mouse Affymetrix platforms (green) or only in one of the two platforms (yellow). The genes and respective fold-changes are presented in detail in Supplementary Table 8.

References

    1. Black DL. Mechanisms of alternative pre-messenger RNA splicing. Annu. Rev. Biochem. 2003;72:291–336. - PubMed
    1. Matlin AJ, Clark F, Smith CW. Understanding alternative splicing: towards a cellular code. Nat. Rev. Mol. Cell Biol. 2005;6:386–398. - PubMed
    1. Jurica MS, Moore MJ. Pre-mRNA splicing: awash in a sea of proteins. Mol. Cell. 2003;12:5–14. - PubMed
    1. Nilsen TW. The spliceosome: the most complex macromolecular machine in the cell? Bioessays. 2003;25:1147–1149. - PubMed
    1. Maniatis T, Tasic B. Alternative pre-mRNA splicing and proteome expansion in metazoans. Nature. 2002;418:236–243. - PubMed

Publication types