. 2008 Jul 29;105(30):10354-9.
doi: 10.1073/pnas.0711884105. Epub 2008 Jul 24.

Systems analysis of the single photon response in invertebrate photoreceptors

Affiliations

Systems analysis of the single photon response in invertebrate photoreceptors

Alain Pumir et al. Proc Natl Acad Sci U S A. .

Abstract

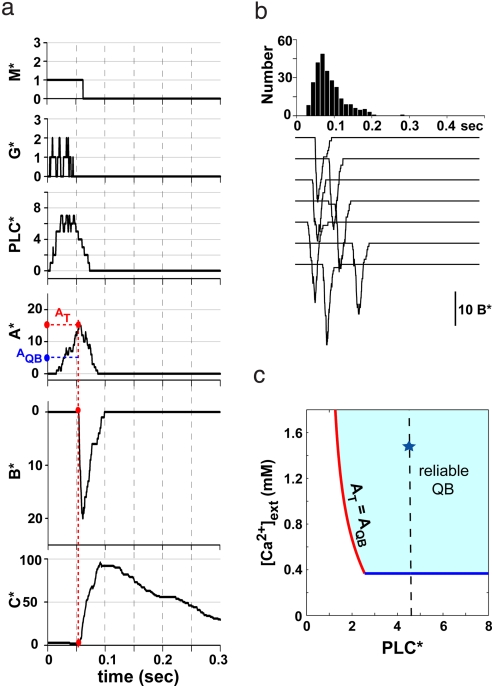
Photoreceptors of Drosophila compound eye employ a G protein-mediated signaling pathway that transduces single photons into transient electrical responses called "quantum bumps" (QB). Although most of the molecular components of this pathway are already known, the system-level understanding of the mechanism of QB generation has remained elusive. Here, we present a quantitative model explaining how QBs emerge from stochastic nonlinear dynamics of the signaling cascade. The model shows that the cascade acts as an "integrate and fire" device and explains how photoreceptors achieve reliable responses to light although keeping low background in the dark. The model predicts the nontrivial behavior of mutants that enhance or suppress signaling and explains the dependence on external calcium, which controls feedback regulation. The results provide insight into physiological questions such as single-photon response efficiency and the adaptation of response to high incident-light level. The system-level analysis enabled by modeling phototransduction provides a foundation for understanding G protein signaling pathways less amenable to quantitative approaches.


Conflict of interest statement

The authors declare no conflict of interest.

Figures

Fig. 1.
Fig. 1.
QBs and the phototransduction cascade. (a) QBs, generated by a brief flash of dim light and recorded by using whole-cell voltage clamp from isolated WT photoreceptor cells. The traces show a brief (≈20 ms) and intense (≈20 pA) inward current. Significant variability is observed, in particular in latency, the histogram of which is shown at the top. (b) Simplified view of the molecular mechanism of invertebrate phototransduction. Absorption of a photon by rhodopsin, via G proteins, activates PLCβ (input module), which generates DAG, which directly or indirectly acts as the activator A* (module A) leading to the opening of TRP channels (B*). The opening of channels is facilitated by the rapid influx of Ca2+ that acts as a positive feedback (fp) comprising module B. At higher concentration, Ca2+ acts via a Ca-binding intermediary (C*) providing the negative feedback (fn) in module C, which terminates the QB. (c) The average profile of aligned QBs. The black curve shows the average of 83 measured QBs, the red one is the model fit.
Fig. 2.
Fig. 2.
Model of QB generation. (a) An example of temporal evolution of the key dynamical variables during a QB. The input module produces ≈5 PLC*, with significant fluctuations. The number of A* molecules rises slowly until it reaches the level AT, when channels start opening rapidly (sharp increase of B*). The value of AT is larger than AQB, the threshold for generating reliable QB. The observed variability in latency, see b, is largely attributable to the fluctuations of the levels AT at which the QB starts. Ultimately, the Ca-dependent inhibitor C* gets produced and terminates the QB. (b) Simulated QBs elicited by activation of a single M* at t = 0. A brief (≈20 ms) opening of ≈20 channels occurs after a latency of ≈80 ms. A significant variability can be seen from the traces, in particular in the latency time, whose distribution is shown at the top. (c) The domain of QB generation in the PLC*–[Ca2+]ex plane defined by the condition that opening of a single channel will, with high probability, generate the opening of many more channels. The star denotes the operating point corresponding to the WT.
Fig. 3.
Fig. 3.
Single photon response in the absence of metarhodopsin deactivation. (a) Simulated dynamics of key variables. M* stays on for the entire period shown. Generation of the first QB is similar to the WT case shown in Fig. 2a; however, as soon as C* goes down, PLC* and A* accumulate again, generating new QBs of smaller amplitude. The amplitudes and time delays between consecutive QBs fluctuate because of the stochastic nature of A* production, which triggers the next QB. (b) Simulated response to the persistent activity of a single M*. Latency distribution for the first QB, shown at the top, is similar to WT (compare with Fig. 2b). A significant variability is seen in the amplitude and in the time delay between consecutive QBs. (c) QB generated by a brief flash of dim light and recorded by using whole-cell voltage clamp from isolated arr23 mutant photoreceptors. The observed response is in qualitative agreement with model predictions.
Fig. 4.
Fig. 4.
Single-photon response of G-protein hypomorphic receptors. (a) An example of temporal evolution of the dynamical variable during the successful generation of a QB. The excitation of a single G protein leads to the activation of a single PLC*, which leads to QB activation only in rare instances when PLC* does not spontaneously deactivate before generating enough A* to ignite a QB. (b) Simulation of the model with a single G protein per microvillus. QBs shown occur once in ≈200 trials. The amplitude of the QB is reduced and the latency increased compared with WT. (c) Measured response of dgq1 mutant cells to dim light. QB have a reduced amplitude (≈5 pA), ≈5-fold longer latency and occur with ≈1,000-fold lower probability compared with the WT.
Fig. 5.
Fig. 5.
Predicted dependence of single-photon response on [Ca2+]ex. Blue line, the mean amplitude of simulated single photon response; red line, the coefficient of variation (i.e., ratio of the root mean square variation to the mean amplitude). Note the peak in the coefficient of variation marking the cross-over to the QB regime. Black line, average response half-width; green line, average response latency. Physiological [Ca2+]ex = 1.5 mM is shown by the vertical arrow.
Fig. 6.
Fig. 6.
Predicted macroscopic response as a function of light flash intensity. (a) Model predictions for the average current response per absorbed photon for flashes of different intensity. Light flashes are assumed to result in a Poisson-distributed number of absorbed photons. Color denotes the mean number of absorbed photons photon per microvillus: 0.1 (cyan), 0.5 (blue), 1 (red), 2 (green), and 4 (magenta). The black curve shows the averaged response to a single absorbed photon. (Inset) Peak amplitude of the macroscopic response as a function of flash intensity. (b) Latency distribution for a QB induced by single (blue) and double (green) metarhodopsin activation event. Simultaneous activation of multiple metarhodopsin molecules reduces the latency of QB generation.

Similar articles

Cited by

References

    1. Henderson SR, Reuss H, Hardie RC. Single photon responses in Drosophila photoreceptors and their regulation by Ca2+ J Physiol. 2000;524(Pt 1):179–194. - PMC - PubMed
    1. Hardie RC, Raghu P. Visual transduction in Drosophila. Nature. 2001;413:186–193. - PubMed
    1. Hardie RC, et al. Molecular basis of amplification in Drosophila phototransduction: Roles for G protein, phospholipase C, and diacylglycerol kinase. Neuron. 2002;36:689–701. - PubMed
    1. Hardie RC. TRP channels in Drosophila photoreceptors: the lipid connection. Cell Calcium. 2003;33:385–393. - PubMed
    1. Ranganathan R, Malicki DM, Zuker CS. Signal transduction in Drosophila photoreceptors. Annu Rev Neurosci. 1995;18:283–317. - PubMed

Publication types

LinkOut - more resources