. 2007 Feb;2(2):121-8.
doi: 10.1038/nnano.2006.206.

A patterned anisotropic nanofluidic sieving structure for continuous-flow separation of DNA and proteins

Affiliations

A patterned anisotropic nanofluidic sieving structure for continuous-flow separation of DNA and proteins

Jianping Fu et al. Nat Nanotechnol. 2007 Feb.

Abstract

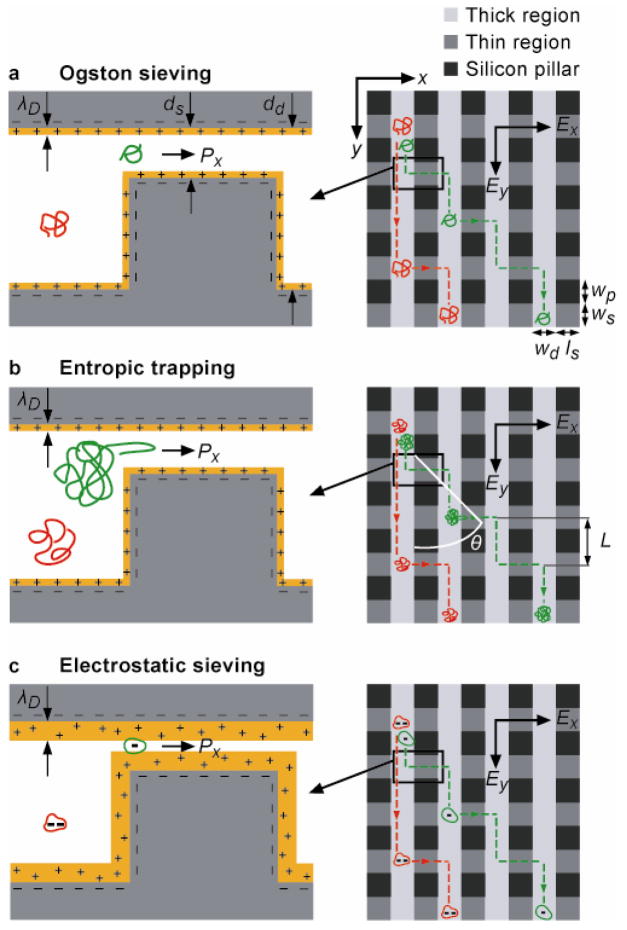
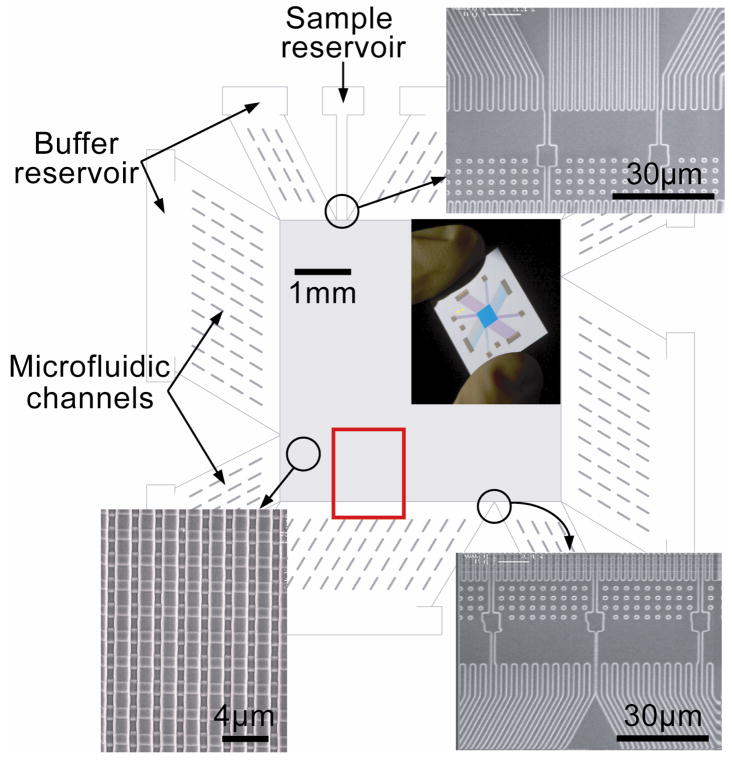
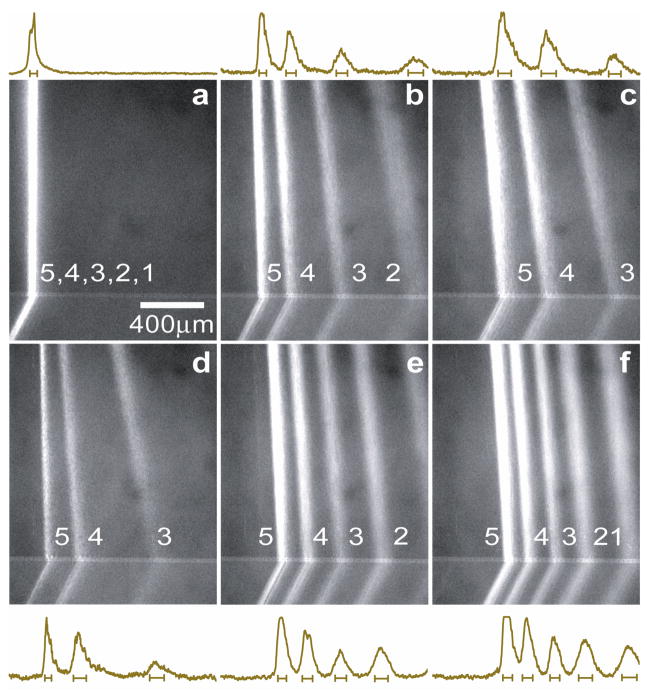
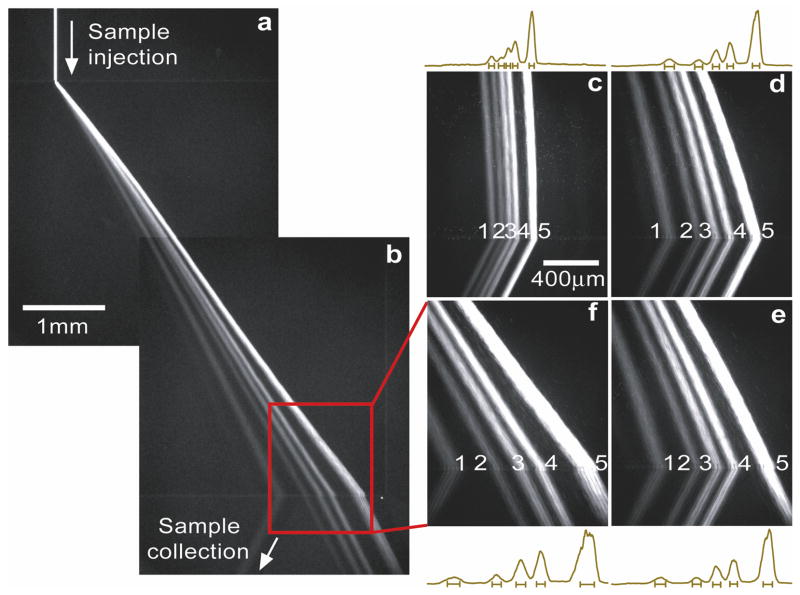
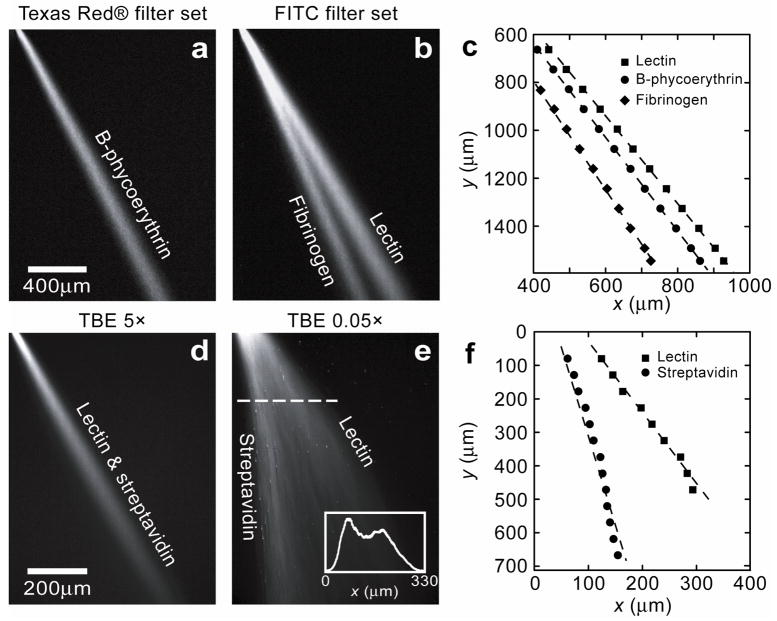
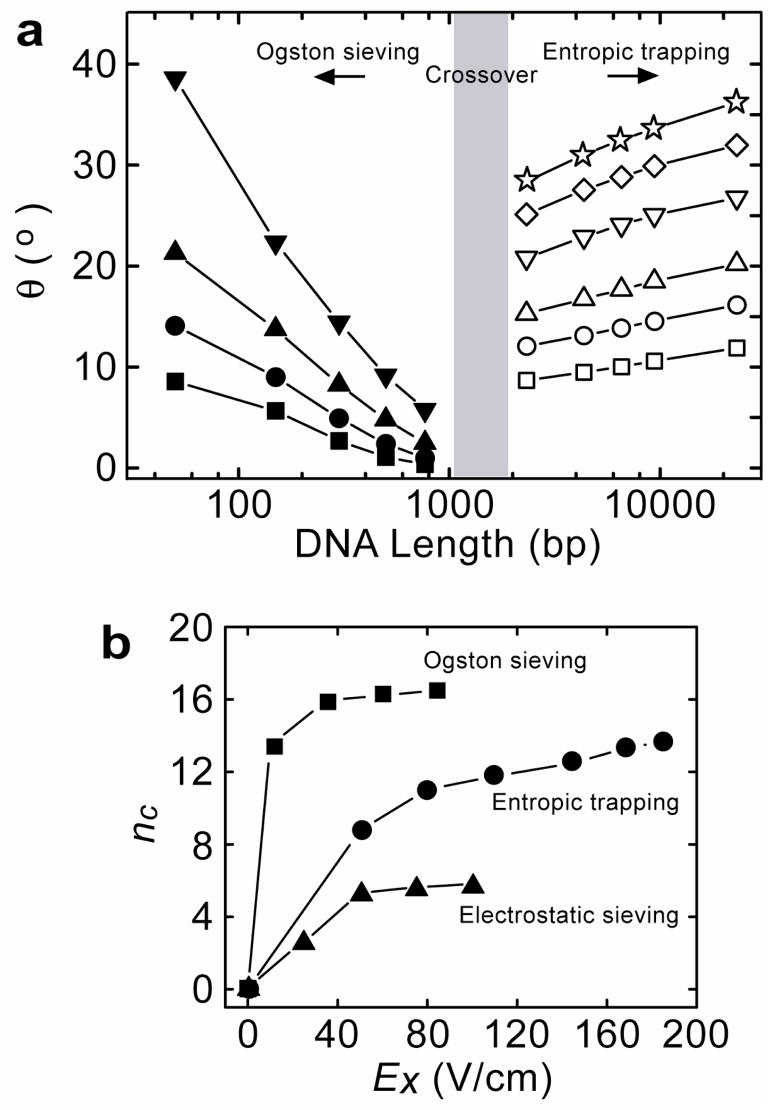
Microfabricated regular sieving structures hold great promise as an alternative to gels to improve the speed and resolution of biomolecule separation. In contrast to disordered porous gel networks, these regular structures also provide well defined environments ideal for the study of molecular dynamics in confining spaces. However, the use of regular sieving structures has, to date, been limited to the separation of long DNA molecules, however separation of smaller, physiologically relevant macromolecules, such as proteins, still remains a challenge. Here we report a microfabricated anisotropic sieving structure consisting of a two-dimensional periodic nanofluidic filter array. The designed structural anisotropy causes different-sized or -charged biomolecules to follow distinct trajectories, leading to efficient separation. Continuous-flow size-based separation of DNA and proteins, as well as electrostatic separation of proteins, was achieved, demonstrating the potential use of this device as a generic molecular sieving structure for an integrated biomolecule sample preparation and analysis system.


Figures

Figure 1
Figure 1. O Schematic showing negatively charged macromolecules assuming bidirectional motion in the ANA under the influence of two orthogonal electric fields Ex and Ey
Nanofilters (width: ws, length: ls, depth: ds) arranged in rows are separated by deep channels (width: ld, depth: dd). Rectangular pillars (width: wp, length: ls) serve as supporting structures to prevent collapse of top ceiling. When the Debye length λD = ds (Debye layer highlighted in yellow) (a, b), steric exclusion effect dictates jump dynamics. For Ogston sieving (a), smaller-sized molecules (green) are preferred for nanofilter passage, resulting in a greater nanofilter jump passage rate Px. For entropic trapping (b), longer linear molecules (green) assume a greater probability for hernia formation and thus a greater passage rate Px. Electrostatic sieving becomes dominant when λD~ds (c). Similar sized globular molecules with a lower negative net charge (green) experiences smaller electrostatic repulsion when crossing negatively-charged nanofilter, resulting in a greater passage rate Px. The mean drift distance L between two consecutive nanofilter crossings plays a determinant role for the migration trajectory, with a shorter L leading to a larger stream deflection angle θ where θ is defined with respect to the positive y-axis.
Figure 2
Figure 2. O Structure of the microfabricated device incorporating the ANA
Scanning electron microscopy images show details of different device regions (clockwise from top right: sample injection channels, sample collection channels, and ANA). The inset shows a photograph of the thumbnail-sized device. The rectangular ANA is 5 mm × 5 mm, and nanofilters (ws=1 gm, ls=1 gm and ds=55 nm) are spaced by 1 μm × 1 μm square-shaped silicon pillars. Deep channels are 1 μm wide (wd) and 300 nm deep (dd). Injection channels connecting sample reservoir (1 mm from the ANA top left corner) inject biomolecule samples as a 30 μm wide stream. The red rectangle highlights the area in which fluorescence photographs in Fig. 3 were taken.
Figure 3
Figure 3. O Ogston sieving of short DNA (the PCR marker) through the ANA
Fluorescent photographs of the PCR marker stream pattern were taken in the area highlighted by the red rectangle in Fig. 2. For a, only Ey applied and Ey=25 V/cm; for b, Ex=35 V/cm, Ey=25 V/cm; for c, Ex=60 V/cm, Ey=25 V/cm; for d, Ex=35 V/cm, Ey=12.5 V/cm; for e, Ex=35 V/cm, Ey=50 V/cm; for f, Ex=35 V/cm, Ey=75 V/cm. Band assignment: (1) 50-bp; (2) 150-bp; (3) 300-bp; (4) 500-bp; (5) 766-bp. Fluorescence intensity profiles (of arbitrary units) were measured at the ANA bottom edge. The bars underneath the peaks are centered at the means and label the stream widths (±s.d.).
Figure 4
Figure 4. O Entropic trapping of long DNA (the λ DNA–Hind III digest) through the ANA
Fluorescent photographs show separation of λ DNAHind III digest with different electric field conditions. For a, b, f, Ex=185 V/cm, Ey=100 V/cm; for c, Ex=50 V/cm, Ey=100 V/cm; for d, Ex=145 V/cm, Ey=100 V/cm; for e, Ex=170 V/cm, Ey=100 V/cm. Band assignment: (1) 2322-bp; (2) 4361-bp; (3) 6557-bp; (4) 9416-bp; (5) 23130-bp. Fluorescence intensity profiles were measured at the ANA bottom edge. The bars underneath the peaks are centered at the means and label the stream widths (±s.d.).
Figure 5
Figure 5. O Continuous-flow separation of proteins through the ANA
Proteins are driven through the ANA following electroosmosis. With TBE 5×, separation time was within a few minutes; with TBE 0.05×, separation time was about tens of seconds. a–b, Fluorescent photographs show separation of lectin, B-phycoerythrin, and fibrinogen at TBE 5× with Ex=100 V/cm and Ey= 50 V/cm. Image a and b were taken for the same ANA area (a with a Texas Red® filter set, b with a FITC filter set). c, Maximum fluorescence intensity along the streams measured for both a and b as a function of x and y. d, No separation was observed for lectin and streptavidin at TBE 5× with Ex=150 V/cm and Ey= 75 V/cm. e, Fluorescent photograph shows separation of lectin and streptavidin at TBE 0.05× with Ex=250 V/cm and Ey= 75 V/cm. The inset shows fluorescence intensity profile scanned along the dashed line (at y=175 μm). Maximum fluorescence intensity along the streams measured for e as a function of x and y is shown in f.
Figure 6
Figure 6. O Ogston sieving, entropic trapping and electrostatic sieving of DNA and proteins in the ANA
a, Stream deflection angle θ as a function of DNA length. Left side (Ogston sieving), Ey=25 V/cm, and Ex: 10 V/cm (□), 35 V/cm (○), 60 V/cm (▲), 85 V/cm (▼). Right side (entropic trapping), Ey=100 V/cm and Ex: 50 V/cm (□), Ex: 80 V/cm (○), Ex: 110 V/cm (△), Ex: 145 V/cm (▽), Ex: 170 V/cm (◇), Ex: 185 V/cm (⋆). The ±s.d. of θ derived from the stream half-width are all less than 1°, so statistical error bars θ for are not plotted. b, Dependence of the effective peak capacity nc on Ex. For Ogston sieving (■), Ey=25 V/cm; for entropic trapping (●), Ey=100 V/cm; for electrostatic sieving (▲), Ey=50 V/cm.

Comment in

References

    1. Scopes RK. Protein Purification, Principles and Practice. 3. Springer-Verlag; New York: 1993.
    1. Giddings JC. Principles and Theory. Marcel Dekker; New York: 1965. Dynamics of Chromatography. Part 1.
    1. Slater GW, Mayer P, Drouin G. Migration of DNA through gels. Methods Enzymol. 1996;270:272–295. - PubMed
    1. Viovy JL. Electrophoresis of DNA and other polyelectrolytes: physical mechanisms. Rev Mod Phys. 2000;72:813–872.
    1. Woolley AT, Mathies RA. Ultra-high-speed DNA fragment separations using microfabricated capillary array electrophoresis chips. Proc Natl Acad Sci U S A. 1994;91:11348–11352. - PMC - PubMed

Publication types

MeSH terms