. 2007 Dec;2(12):775-9.
doi: 10.1038/nnano.2007.381. Epub 2007 Dec 2.

Recapturing and trapping single molecules with a solid-state nanopore

Recapturing and trapping single molecules with a solid-state nanopore

Marc Gershow et al. Nat Nanotechnol. 2007 Dec.

Abstract

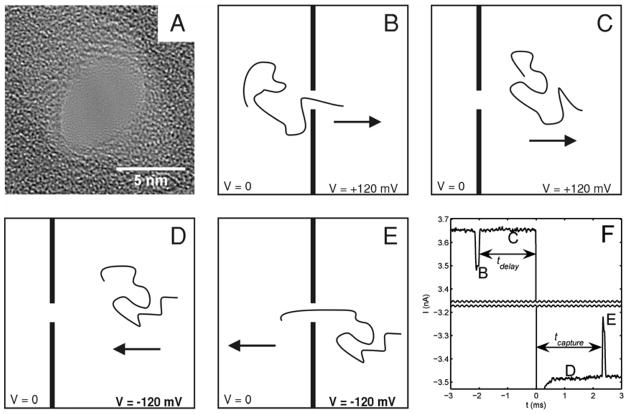
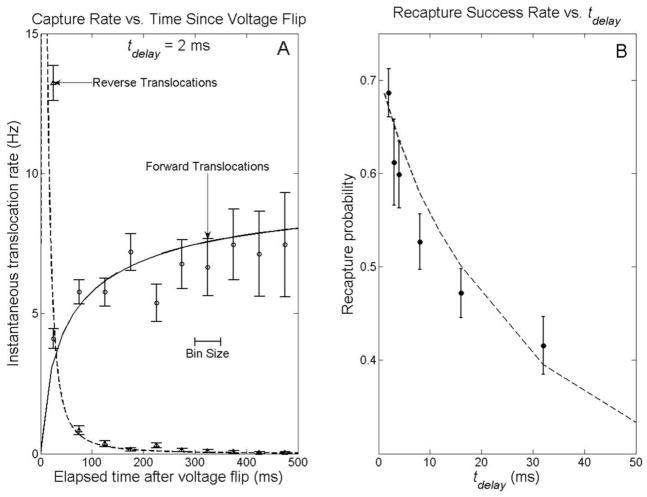
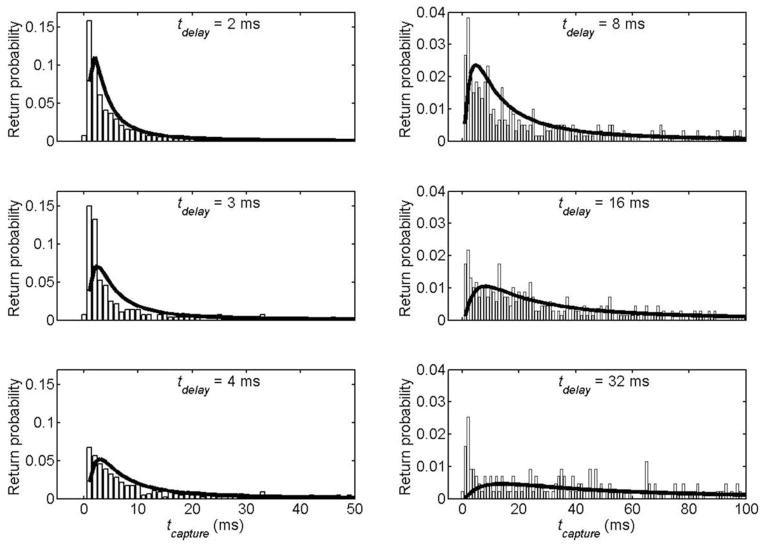
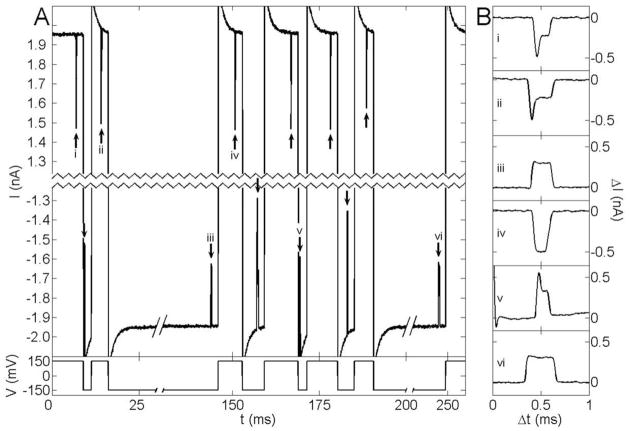
The development of solid-state nanopores, inspired by their biological counterparts, shows great potential for the study of single macromolecules. Applications such as DNA sequencing and the exploration of protein folding require control of the dynamics of the molecule's interaction with the pore, but DNA capture by a solid-state nanopore is not well understood. By recapturing individual molecules soon after they pass through a nanopore, we reveal the mechanism by which double-stranded DNA enters the pore. The observed recapture rates and times agree with solutions of a drift-diffusion model. Electric forces draw DNA to the pore over micrometer-scale distances, and upon arrival at the pore, molecules begin translocation almost immediately. Repeated translocation of the same molecule improves measurement accuracy, offers a way to probe the chemical transformations and internal dynamics of macromolecules on sub-millisecond time and sub-micrometre length scales, and demonstrates the ability to trap, study and manipulate individual macromolecules in solution.


Figures

Figure 1
Figure 1
Overview of the recapture experiment. A) TEM of the SiN nanopore used. B–E) Schematic representation of the experiment. The arrow represents the direction of the electric force on the DNA molecule. B) A single DNA molecule passes through the nanopore in the forward direction. C) After passing through the pore, the molecule moves away from the pore under the influence of the electric field for a fixed delay time. D) The field is reversed, and the molecule moves towards the pore. E) The molecule passes through the pore in the reverse direction. F) A representative current trace for an experiment with a 2 ms delay before voltage reversal. A gap of 6.6 nA is omitted from the middle of the trace. The letters mark the correspondence between the current trace and the schematic illustrations of molecular motion. Molecules cannot be detected passing the pore during the first 300 μs after voltage reversal while the capacitance of the nanopore/flow cell system charges.
Figure 2
Figure 2
Capture rates and recapture probabilities. A) Instantaneous capture rates for the 2 ms delay experiment. Each point represents the average rate at which molecules entered the pore in the surrounding 50 ms time interval (e.g. the point at 25 ms represents the rate between 0 and 50 ms after the voltage flip). The solid (forward-biased capture) and dashed (recapture) lines represent the predictions of the drift-diffusion model discussed in the text. B) Fraction of molecules recaptured within 500 ms of voltage reversal, as a function of time delay between forward translocation detection and voltage reversal. The dashed line represents the prediction of the drift-diffusion model discussed in the text.
Figure 3
Figure 3
Capture time histograms for returning molecules for different delays prior to voltage reversal. Each bar represents the fraction of forward translocated molecules recaptured in the 1 ms interval centered about the corresponding time. Note the axes have different scales for the left and right histograms. The bold lines represents the predictions of the drift-diffusion model discussed in the text.
Figure 4
Figure 4
Current vs. time traces from a single molecule trapping experiment. A) A single 10 kbp dsDNA molecule passes the pore twelve times over 250 ms. The main panel shows the current through the pore vs. time. For clarity, 2.4 nA are excised from the center of the current axis, and the time axis has also been compressed. The short pulses (marked with arrows) show current being blocked as the molecule passes through the pore. 2 ms after each passage, the voltage bias (plotted below the current) is reversed. As in Figure 1, the molecule is initially captured at positive voltage bias. The exponential settling at the beginning of each transition results from charging of the membrane capacitance. B) Expanded current traces resulting from separate passages of the molecule through the pore. Each is labeled by a Roman numeral that identifies the portion of the current trace in A from which it was taken.

References

    1. Li J, et al. Ion-beam sculpting at nanometre length scales. Nature. 2001;412:166–169. - PubMed
    1. Storm AJ, Chen JH, Ling XS, Zandbergen HW, Dekker C. Electron-beam-induced deformations of SiO2 nanostructures. Journal of Applied Physics. 2005;98
    1. Wu MY, Krapf D, Zandbergen M, Zandbergen H, Batson PE. Formation of nanopores in a SiN/SiO2 membrane with an electron beam. Applied Physics Letters. 2005;87
    1. Chen P, et al. Atomic layer deposition to fine-tune the surface properties and diameters of fabricated nanopores. Nano Letters. 2004;4:1333–1337. - PMC - PubMed
    1. Lo CJ, Aref T, Bezryadin A. Fabrication of symmetric sub-5 nm nanopores using focused ion and electron beams. Nanotechnology. 2006;17:3264–3267.

Publication types