. 2008 Jul 25;4(7):e1000130.
doi: 10.1371/journal.pcbi.1000130.

Optimal compensation for temporal uncertainty in movement planning

Affiliations

Optimal compensation for temporal uncertainty in movement planning

Todd E Hudson et al. PLoS Comput Biol. .

Abstract

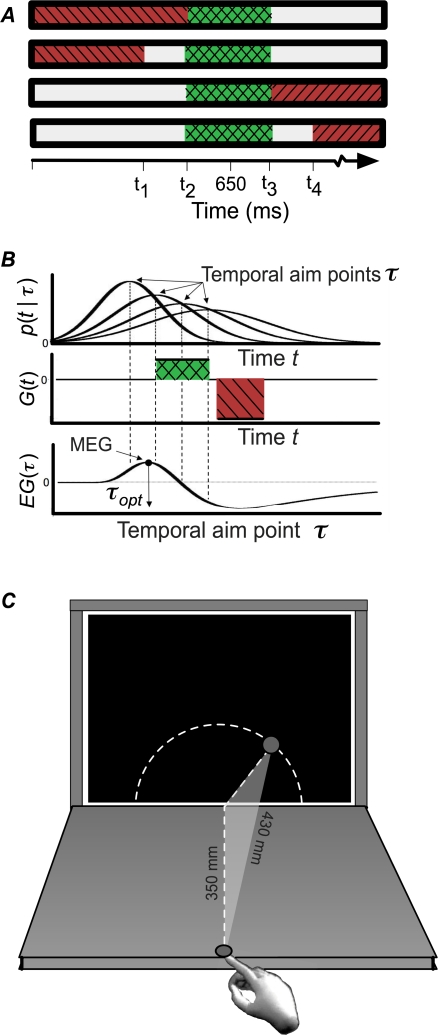
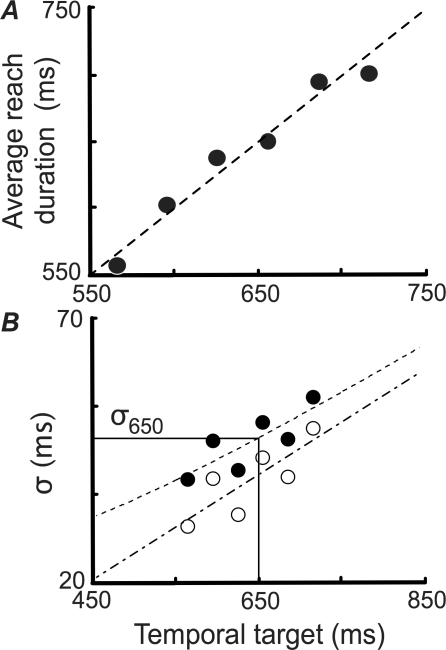
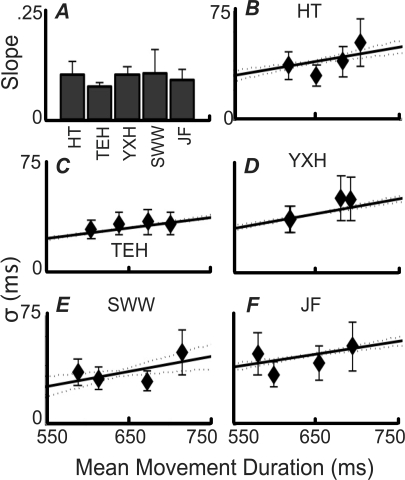
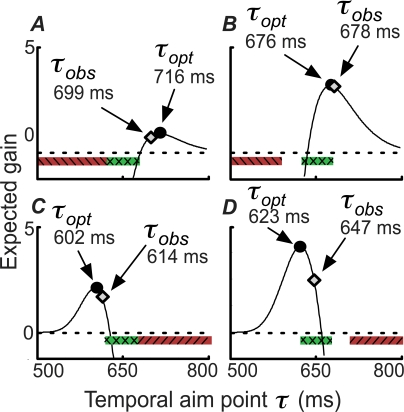
Motor control requires the generation of a precise temporal sequence of control signals sent to the skeletal musculature. We describe an experiment that, for good performance, requires human subjects to plan movements taking into account uncertainty in their movement duration and the increase in that uncertainty with increasing movement duration. We do this by rewarding movements performed within a specified time window, and penalizing slower movements in some conditions and faster movements in others. Our results indicate that subjects compensated for their natural duration-dependent temporal uncertainty as well as an overall increase in temporal uncertainty that was imposed experimentally. Their compensation for temporal uncertainty, both the natural duration-dependent and imposed overall components, was nearly optimal in the sense of maximizing expected gain in the task. The motor system is able to model its temporal uncertainty and compensate for that uncertainty so as to optimize the consequences of movement.


Conflict of interest statement

The authors have declared that no competing interests exist.

Figures

Figure 1
Figure 1. Reward/Penalty Configurations and Expected Gain.
(A) Four reward/penalty configurations. The horizontal axis represents time (ms) and the color of each interval specified the reward the subject received if the reach time fell within that interval. Intervals that incurred penalties (−36 points) were coded red (also striped in the figure), those that earned reward (+12 points), green (also cross-hatched). The choice of times t 1,…,t 4 that defined the reward and penalty regions was defined based on each subject's movement duration variance (for a target duration of 650 ms) to equate task difficulty. (B) Expected gain calculation. Upper Panel: The Gaussian distribution of actual movement durations t for four choices of planned movement durations τ. The vertical dashed lines mark four possible planned movement durations. Standard deviations σ(τ) increase linearly with planned duration. Middle Panel: The gain G(t) associated with each actual movement duration t. Lower Panel: Expected gain EG(t) as a function of planned movement duration τ. Expected gain is determined by the probability that the actual movement duration falls into the reward or penalty regions. The maximum expected gain (MEG) and the corresponding planned movement duration τopt are indicated. (C) Schematic diagram showing the geometric relationship between the start position of the reach and the circular arc along which spatial reach targets were drawn. Reach distance was always 430 mm, regardless of the position of the target along the arc.
Figure 2
Figure 2. Data from the Training Trials for One Subject (HT).
(A) Mean observed time versus experimenter-specified target time with a line of slope = 1, intercept = 0 superimposed. (B) Temporal uncertainty σ(τ) is plotted as a function of planned movement duration τ for both noise-added (filled symbols, dashed line) and unperturbed (open symbols, fitted dash-dotted line) data. The estimated uncertainty σ 650 for a movement of planned duration 650 ms was used to equate the difficulty of the task across subjects. Subjects' fitted slopes (unperturbed) are provided in Figure 3.
Figure 3
Figure 3. Temporal Uncertainty Functions by Subject.
(A) Fitted slope values ασ±1 SE for temporal uncertainty functions calculated from training data. The corresponding intercepts (βσ) were −25, −19, −26, −31 and −10 ms, respectively. (B–F) Temporal uncertainty functions calculated from unperturbed training data (solid lines; the dotted lines represent±1 SE) with temporal uncertainty measured during each of the four experimental conditions (diamonds) overlaid.
Figure 4
Figure 4. Expected Gain as a Function of Planned Movement Duration for One Subject (HT).
The expected gain EG(τ) for each possible planned movement duration is shown as a solid line. MEG points are marked as circles and observed mean durations are marked as diamonds. The four panels A–D correspond to the four conditions in Figure 1A. Reward and penalty regions are coded as in Figure 1A.
Figure 5
Figure 5. Residuals.
Residual differences between mean movement duration and model predictions under the assumptions of each of the four models (M 0M 3). Data from HT, as described in Figure 4, are plotted as diamonds.

References

    1. Billaut F, Basset FA, Falgairette G. Muscle coordination changes during intermittent cycling sprints. Neurosci Lett. 2005;380:265–269. - PubMed
    1. Churchyard AJ, Morris ME, Georgiou N, Chiu E, Cooper R, et al. Gait dysfunction in Huntington's disease: Parkinsonism and a disorder of timing. Adv Neurol. 2001;87:375–385. - PubMed
    1. Corcos DM, Jiang HY, Wilding J, Gottlieb GL. Fatigue induced changes in phasic muscle activation patterns for fast elbow flexion movements. Exp Brain Res. 2002;142:1–12. - PubMed
    1. Gribble PL, Ostry DJ. Compensation for Interaction Torques During Single- and Multijoint Limb Movement. J Neurophysiol. 1999;82:2310–2326. - PubMed
    1. Howard RM, Shea CH, Herbert WG. The effects of fatigue on the control of a coincident timing response. J Gen Psychol. 1982;106:263–271. - PubMed

Publication types