. 2008 Jul 25;4(7):e1000135.
doi: 10.1371/journal.pcbi.1000135.

Prediction by graph theoretic measures of structural effects in proteins arising from non-synonymous single nucleotide polymorphisms

Affiliations

Prediction by graph theoretic measures of structural effects in proteins arising from non-synonymous single nucleotide polymorphisms

Tammy M K Cheng et al. PLoS Comput Biol. .

Abstract

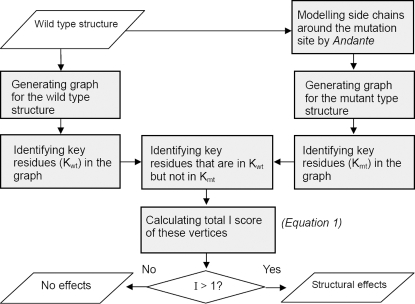
Recent analyses of human genome sequences have given rise to impressive advances in identifying non-synonymous single nucleotide polymorphisms (nsSNPs). By contrast, the annotation of nsSNPs and their links to diseases are progressing at a much slower pace. Many of the current approaches to analysing disease-associated nsSNPs use primarily sequence and evolutionary information, while structural information is relatively less exploited. In order to explore the potential of such information, we developed a structure-based approach, Bongo (Bonds ON Graph), to predict structural effects of nsSNPs. Bongo considers protein structures as residue-residue interaction networks and applies graph theoretical measures to identify the residues that are critical for maintaining structural stability by assessing the consequences on the interaction network of single point mutations. Our results show that Bongo is able to identify mutations that cause both local and global structural effects, with a remarkably low false positive rate. Application of the Bongo method to the prediction of 506 disease-associated nsSNPs resulted in a performance (positive predictive value, PPV, 78.5%) similar to that of PolyPhen (PPV, 77.2%) and PANTHER (PPV, 72.2%). As the Bongo method is solely structure-based, our results indicate that the structural changes resulting from nsSNPs are closely associated to their pathological consequences.


Conflict of interest statement

The authors have declared that no competing interests exist.

Figures

Figure 1
Figure 1. The graph model of Bongo.
(A) A graph that represents the residue-residue interaction network in the p53 core domain. Each vertex in the graph represents a residue: the pink ones are in α-helices; the yellow are in β-strands and the white are in loops. The edges with different colors represent different interactions: blue for hydrogen bonds; cyan for π–π interactions; purple for π-cation interactions; green for hydrophobic interactions; black for backbones. The grey patches indicate segments of secondary structures, patches that are too close to each other can not be separated in the graph. (B) Residue I195 in p53 core domain has non-polar interactions with residues A159, V216, Y234, and Y236, and these local hydrophobic interactions are transformed into graph (A), where I195 is shown as a red vertex and A159, V216, Y234, and Y236 are shown as green vertices. (C) The overall structure of p53 core domain, where the location of I195 is shown in red.
Figure 2
Figure 2. An example showing local structural changes between wild-type and mutant-type proteins.
(A) Local environment around residue Y35 in protein 1BPI. (B) Wild-type local interaction graph around residue Y35. The interactions with residue R20, N44, and A40 are marked in the same colours as in (A). (C) Mutant-type local interaction graph around position 35.
Figure 3
Figure 3. nsSNP Y35G in protein 1BPI.
(A) Key residues (in blue) whose interactions are changed when the mutation Y35G is introduced into protein 1BPI. The key residue Y35 (upper) has a pi-cation interaction with residue N44 in the wild-type structure (shown in grey) and the interaction is abolished when the mutation happens (the mutant-type structure is shown in yellow). The key residue R42 (lower) has a π–cation interaction with residue F4 in the wild-type structure and the interaction is abolished when the mutation happens (the corresponding position of R42 in the mutant structure is shown with a yellow side chain). (B) Key residues that are specific in the modelled mutant-type structure are shown in blue, while those are specific in the crystal structure are shown in green. The wild-type structure of 1BPI is shown in grey, while the region that under conformational change due to the mutation Y35G is shown in yellow.
Figure 4
Figure 4. Correlation between the residue priority and the stability change ΔΔG in the p53 core domain.
(A) Correlation between the key residue priority and the stability change ΔΔG of key residues. (B) Correlation between the assumptive priority and the stability change ΔΔG of non-key residues. Open circle markers represent key residues in loops, triangle markers represent key residues in strands, and cross markers represent key residues in helix.
Figure 5
Figure 5. The flowchart of Bongo.
Scheme showing how Bongo works (see text for details).
Figure 6
Figure 6. The eight nsSNPs that are listed in Table 1.
Structure of p53 core domain is shown in grey at right; DNA is shown in grey at left; the nsSNPs are shown in black sticks.
Figure 7
Figure 7. Scheme showing the algorithm that Bongo uses to identify key residues.
In step 1, vertex 3 is identified as the first key residue since it has the greatest weight (4.5) of edges connected to it. In step 2, vertex 3 and all the edges connected to it are eliminated from the graph, and the next key residue is vertex 4 since it has the greatest weight (4) in the remaining graph. In step 3, there is no edge left in the graph thus the process of identifying key residues is terminated (if there are any edges left in the graph, the process of step 2 is repeated until no edge is left). Therefore, the key residues in this example are {3, 4}, and residue 3 is more important than residue 4 in terms of forming the graph.

References

    1. Sherry ST, Ward MH, Kholodov M, Baker J, Phan L, et al. dbSNP: the NCBI database of genetic variation. Nucleic Acids Res. 2001;29:308–311. - PMC - PubMed
    1. Hamosh A, Scott AF, Amberger J, Bocchini C, Valle D, et al. Online Mendelian Inheritance in Man (OMIM), a knowledgebase of human genes and genetic disorders. Nucleic Acids Res. 2002;30:52–55. - PMC - PubMed
    1. Bond GL, Hu W, Levine A. A single nucleotide polymorphism in the MDM2 gene: from a molecular and cellular explanation to clinical effect. Cancer Res. 2005;65:5481–5484. - PubMed
    1. Pauli-Magnus C, Kroetz DL. Functional implications of genetic polymorphisms in the multidrug resistance gene MDR1 (ABCB1). Pharm Res. 2004;21:904–913. - PubMed
    1. Sunyaev S, Ramensky V, Koch I, Lathe WI, Kondrashov AS, et al. Prediction of deleterious human alleles. Hum Mol Genet. 2001;10:591–597. - PubMed

Publication types

LinkOut - more resources