. 2008 Jul 1;6(7):e158.
doi: 10.1371/journal.pbio.0060158.

Neuronal correlates of the set-size effect in monkey lateral intraparietal area

Affiliations

Neuronal correlates of the set-size effect in monkey lateral intraparietal area

Puiu F Balan et al. PLoS Biol. .

Abstract

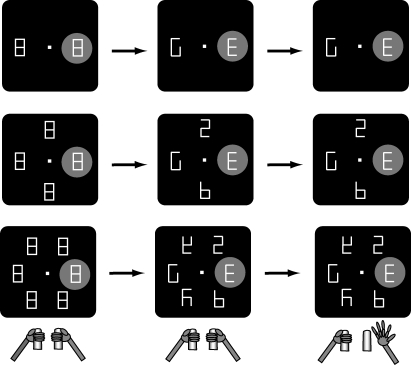
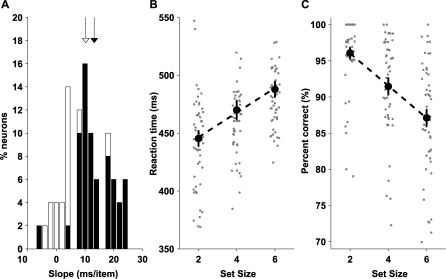
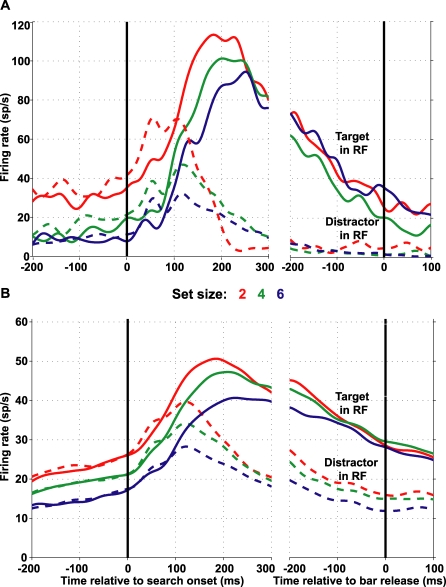
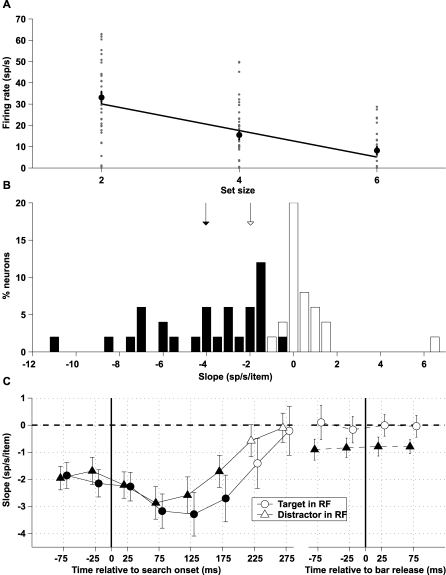
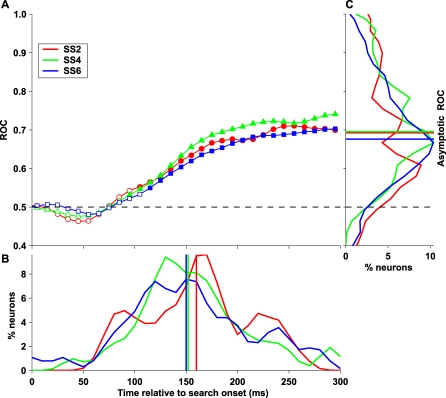
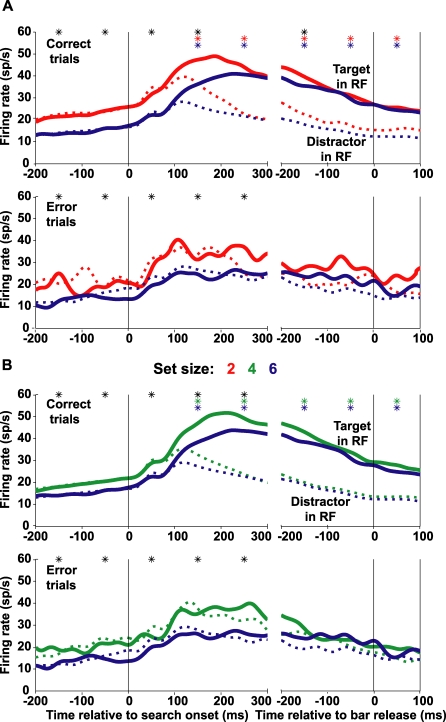
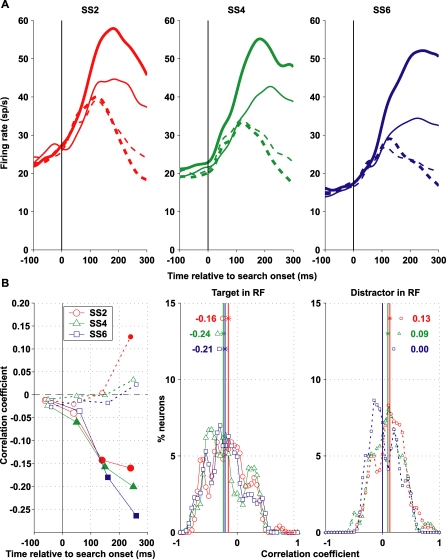
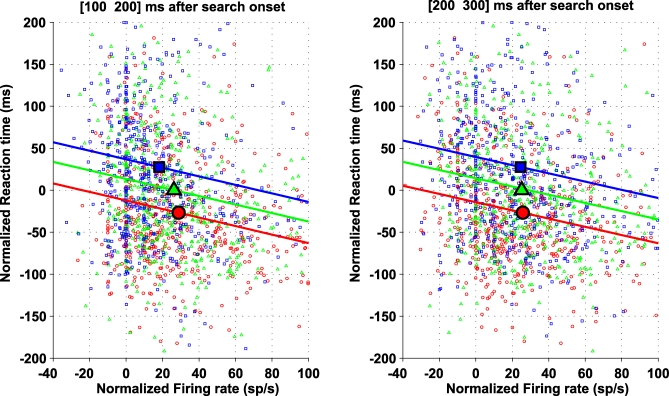
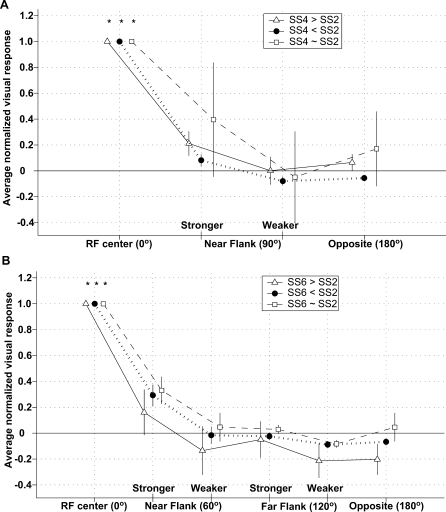
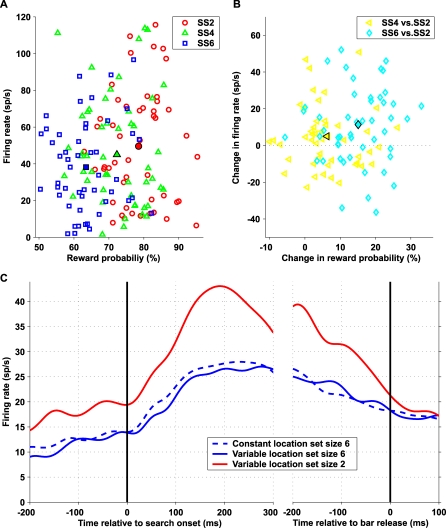
It has long been known that the brain is limited in the amount of sensory information that it can process at any given time. A well-known form of capacity limitation in vision is the set-size effect, whereby the time needed to find a target increases in the presence of distractors. The set-size effect implies that inputs from multiple objects interfere with each other, but the loci and mechanisms of this interference are unknown. Here we show that the set-size effect has a neural correlate in competitive visuo-visual interactions in the lateral intraparietal area, an area related to spatial attention and eye movements. Monkeys performed a covert visual search task in which they discriminated the orientation of a visual target surrounded by distractors. Neurons encoded target location, but responses associated with both target and distractors declined as a function of distractor number (set size). Firing rates associated with the target in the receptive field correlated with reaction time both within and across set sizes. The findings suggest that competitive visuo-visual interactions in areas related to spatial attention contribute to capacity limitations in visual searches.


Conflict of interest statement

Competing interests. The authors have declared that no competing interests exist.

Figures

Figure 1
Figure 1. The Covert Search Task
The task was run in randomly interleaved trial blocks with set sizes of 2, 4, or 6 elements (top, middle, and bottom rows). A circular array with the appropriate number of figure-8 placeholders remained on the screen in the intertrial interval. To initiate each trial monkeys fixated a central fixation point and grasped two response bars positioned at waist level, outside their field of view (left panels). During central fixation, one placeholder fell in the center of the neuron's RF (gray patch). After a 500 ms presearch period, two line segments were removed from each placeholder, revealing several distractors and one target, an E-like shape (middle panels). Monkeys were rewarded for maintaining fixation and reporting the orientation of the target by releasing the right bar if the “E” was right-facing (right panels) or the left bar if it was left-facing.
Figure 2
Figure 2. Behavioral Performance
(A) Dependence of reaction time on set size in the 50 recording sessions that tested all set sizes. Histogram shows the distribution of slopes representing the dependence of reaction time on set size. Filled bars indicate slopes significantly different from 0. Arrows show the average slope for the entire population (open) and for the significant subset (filled). (B) Dependence of reaction time on set size across the population. Each gray dot is the average reaction time from one session, and the large filled symbols show average and standard error across the sample. The dashed line is the best fit through the data points using Equation 1 (Materials and Methods section). (C) Dependence of accuracy on set size. Each small gray point is the fraction correct in one session (same sessions as in (A) and (B)), and the line shows the best fit to Equation 1 with accuracy as the dependent variable.
Figure 3
Figure 3. Set-Size Effect in LIP Neurons
(A) Response of a representative neuron (neuron 12289), on trials in which the target (solid) or a distractor (dotted) were in the RF, at set-size 2 (red), 4 (green), and 6 (blue). Responses are aligned on search display onset (removal of line segments, time 0) in the left panel and on bar release in the right panel. For display purposes only, spike density histograms were derived by convolving individual spike times with a Gaussian kernel with a standard deviation of 15 ms. Standard error (computed every 1 ms and averaged across all conditions and time bins) was 2.69 spikes/s. (B) Average responses in the sample of neurons tested with all three set sizes (n = 50) using the same conventions as in (A). Average standard error was 2.73 spikes/s.
Figure 4
Figure 4. Magnitude and Time Course of the Set-Size Effect
(A) Calculation of the set-size effect in the presearch epoch for the neuron shown in Figure 3A. Each point represents firing rate in a correct trial in the 100 ms before search onset. Filled symbols show the mean and standard error, and the line is the best fit linear regression (Materials and Methods section, Equation 2). (B) Distribution of slopes in the presearch epoch (100 ms before bar release) for all 50 neurons. Filled bars show neurons with significant slopes. Arrows show the average for the entire sample (open) and for significant values (56%; filled). (C) Time course of the set-size effect. Each point shows the slope (mean and standard error, n = 50 neurons) in 50 ms consecutive bins aligned on search onset (left) or bar release (right). Circles show trials in which the target was in the RF; triangles show distractor trials. Filled symbols show values significantly smaller than 0.
Figure 5
Figure 5. Target Location Selectivity
(A) ROC indices reflecting neuronal discrimination between target and distractor for set-size 2 (red circles), 4 (green triangles), and 6 (blue squares). Points show the average indices across the 50 neurons tested at all three set sizes. Filled symbols indicate statistically significant ROC values (p < 0.05 relative to 0.5, t-test). (B) Distributions of times at which discrimination between target and distractor became reliable on a neuron-by-neuron basis for set-size 2 (red), 4 (green), and 6 (blue). The vertical lines indicate medians. (C) The distribution of asymptotic ROC values calculated as the average ROC values in a 200–300 ms interval after the search onset for each neuron and each set size. Lines indicate medians.
Figure 6
Figure 6. Firing Rates in Correct and Error Trials
(A) Average firing rates in correct and error trials, when the target (solid) or a distractor (dashed) was in the RF at set sizes 2 and 6. Data are from 55 neurons that had at least three error trials in each category. The black asterisks (top row) show 100 ms time bins in which firing rates differed significantly between the two set sizes. The red and blue asterisks (next two rows) show 100 ms time bins in which firing rates differed significantly between target and distractors in the RF at the corresponding set size. (B) Same as in (A), for 53 neurons tested at set-size 4 and 6.
Figure 7
Figure 7. Correlations between Firing Rate and Reaction Time within Each Set Size
(A) Population firing rates averaged for trials with responses shorter and longer than the median (thick and thin traces) for the target or distractors in the RF (solid and dashed traces). (B) Correlation coefficients between firing rates and reaction time. Left panel shows the population correlation coefficient computed in 100 ms time bins when the target (solid lines) or a distractor (dashed lines) was in the RF, at set-size 2, 4, or 6. Filled symbols indicate statistically significant values (p < 0.05). Middle and right panels show the distribution of coefficients from individual neurons between 200 and 300 ms after search display onset when the target or a distractor was in the RF. Vertical lines and numbers indicate medians; the star represents p < 0.05 relative to 0.
Figure 8
Figure 8. Correlation between Reaction Time and Firing Rates across Set Sizes
Each point shows the data from an individual trial (target in the RF), with data from all 50 neurons pooled together. For clarity of presentation only 50% of points (randomly selected) are depicted. Reaction times are normalized by subtracting each neuron's mean reaction time. Firing rates are normalized by subtracting each neuron's average firing rate (−200 to 300 ms after search onset, all correct target and distractor trials at all set sizes), which explains why firing rates are shifted toward positive values. Filled symbols show the average reaction time and firing rates for each set size. Lines are best-fit solutions using ANCOVA (see text).
Figure 9
Figure 9. Receptive Field Profiles for Neurons with and without Set-Size Effects
(A) Each point shows the normalized visual response (average ± standard deviation) on the memory-guided saccade task at the locations tested with set-size 4 for neurons with different effects of set size. Responses from locations equidistant from the RF center were pooled according to their relative response magnitude (i.e., the location eliciting the stronger or weaker response) regardless of whether they were displaced clockwise or counterclockwise from the RF center. Stars indicate p < 0.05 relative to 0. (B) Same as (A) but for set-size 6.
Figure 10
Figure 10. Firing Rates Are Not Correlated with Reward or Target Location Probability
(A) Within set-size analysis. Each neuron's average firing rate (100–200 ms after search onset, target in RF, correct trials) is plotted as a function of reward probability in the corresponding trial block. The average firing rates were 49.6 ± 4.4, 44.7 ± 4.3, and 38.2 ± 3.5 spikes/s for set sizes 2, 4, and 6 (p < 0.05, one-way ANOVA). Overall correlation was not significant (r = 0.11, p = 0.2). (B) Across set-size analysis. The difference in average firing rates at set-size 2 versus set-size 4 (triangles), and set-size 2 versus set-size 6 (rhombuses) as a function of the corresponding differences in reward probability. Differences are calculated using data on correct trials in which the target appeared in the RF. The correlation coefficient for the entire dataset was not significant (r = 0.0001, p = 0.99). The average values ± standard errors for changes in reward probabilities were 6.2 ± 1.3 % and 15.1 ± 1.2 % for set-size 2 vs. 4 and set-size 2 versus 6, respectively; the corresponding changes in firing rates were 5.0 ± 3.2 and 11.3 ± 3.2 spikes/s. (C) Average firing rates (n = 10 neurons) when the target was in the RF, for set-size 6 (blue) with 100% (dashed) and 16.7% (solid) location probability, and for set-size 2 (red) with 50% location probability.

Similar articles

Cited by

References

    1. Pelli DG, Palomares M, Majaj NJ. Crowding is unlike ordinary masking: distinguishing feature integration from detection. J Vis. 2004;4:1136–1169. - PubMed
    1. Parkes L, Lund J, Angelucci A, Solomon JA, Morgan M. Compulsory averaging of crowded orientation signals in human vision. Nat Neurosci. 2001;4:739–744. - PubMed
    1. Wolfe JM. Guided Search 2.0: a revised model of visual search. Psychon Bull Rev. 1994;1:202–238. - PubMed
    1. McElree B, Carrasco M. The temporal dynamics of visual search: evidence for parallel processing in feature and conjunction searches. J Exp Psychol Hum Percept Perform. 1999;25:1517–1539. - PMC - PubMed
    1. Wolfe JM, O'Neill P, Bennett SC. Why are there eccentricity effects in visual search? Visual and attentional hypotheses. Percept Psychophys. 1998;60:140–156. - PubMed

Publication types