

Suppression of beta oscillations in the subthalamic nucleus following cortical stimulation in humans
- PMID: 18657185
- PMCID: PMC2695156
- DOI: 10.1111/j.1460-9568.2008.06363.x
Suppression of beta oscillations in the subthalamic nucleus following cortical stimulation in humans
Abstract
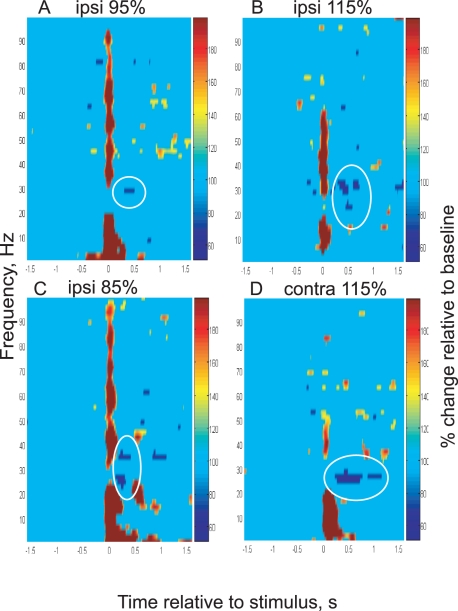
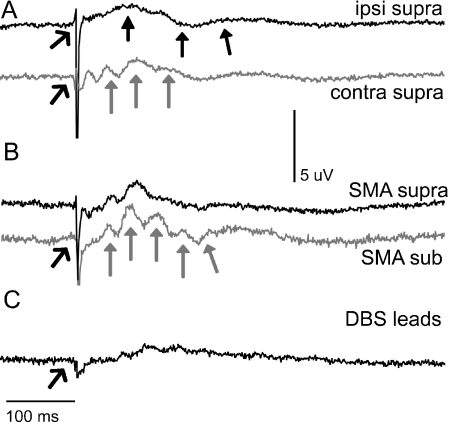
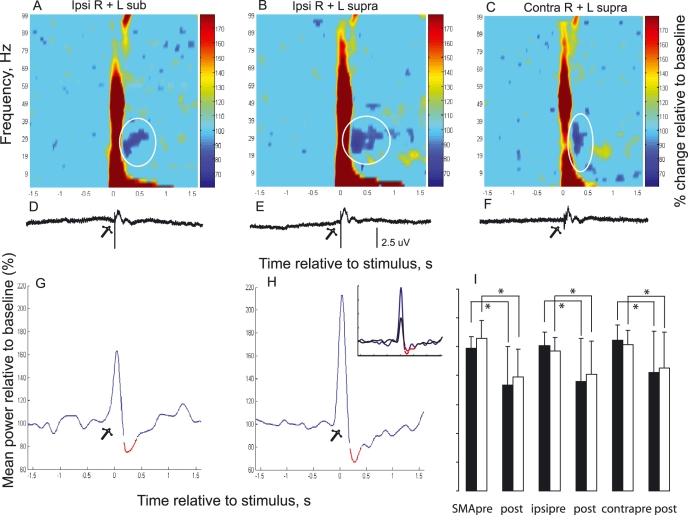
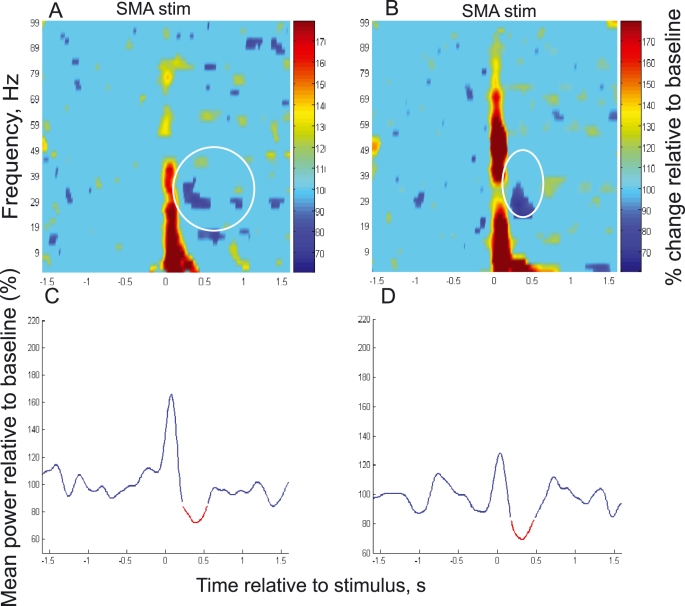
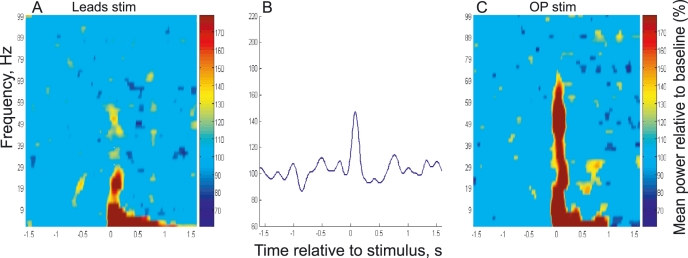
It is unclear how subthalamic nucleus activity is modulated by the cerebral cortex. Here we investigate the effect of transcranial magnetic stimulation (TMS) of the cortex on oscillatory subthalamic local field potential activity in the 8-35 Hz (alpha/beta) band, as exaggerated synchronization in this band is implicated in the pathophysiology of parkinsonism. We studied nine patients with Parkinson's disease (PD) to test whether cortical stimulation can modulate synchronized oscillations in the human subthalamic nucleus. With patients at rest, single-pulse TMS was delivered every 5 s over each primary motor area and supplementary motor area at intensities of 85-115% resting motor threshold. Subthalamic local field potentials were recorded from deep brain stimulation electrodes implanted into this nucleus for the treatment of PD. Motor cortical stimulation suppressed beta activity in the subthalamic nucleus from approximately 0.2 to 0.6 s after TMS (repeated measures anova; main effect of time, P < 0.01; main effect of side, P = 0.03), regardless of intensity. TMS over the supplementary motor area also reduced subthalamic beta activity at 95% (P = 0.05) and 115% resting motor threshold (P = 0.01). The oscillatory activity decreased to 80 +/- 26% of baseline (averaged across sites and stimulation intensities). Suppression with subthreshold stimuli confirmed that these changes were centrally driven and not due to peripheral afference. The results may have implications for mechanisms underlying the reported therapeutic benefits of cortical stimulation.
Figures
Similar articles
-
Deep brain stimulation modulates synchrony within spatially and spectrally distinct resting state networks in Parkinson's disease.Brain. 2016 May;139(Pt 5):1482-96. doi: 10.1093/brain/aww048. Epub 2016 Mar 26. Brain. 2016. PMID: 27017189 Free PMC article.
-
Cortical Plasticity Induction by Pairing Subthalamic Nucleus Deep-Brain Stimulation and Primary Motor Cortical Transcranial Magnetic Stimulation in Parkinson's Disease.J Neurosci. 2016 Jan 13;36(2):396-404. doi: 10.1523/JNEUROSCI.2499-15.2016. J Neurosci. 2016. PMID: 26758832 Free PMC article.
-
The nature and time course of cortical activation following subthalamic stimulation in Parkinson's disease.Cereb Cortex. 2010 Aug;20(8):1926-36. doi: 10.1093/cercor/bhp269. Epub 2009 Dec 17. Cereb Cortex. 2010. PMID: 20019146
-
The subthalamic nucleus, oscillations, and conflict.Mov Disord. 2015 Mar;30(3):328-38. doi: 10.1002/mds.26072. Epub 2015 Feb 17. Mov Disord. 2015. PMID: 25688872 Free PMC article. Review.
-
[Motor cortex stimulation for Parkinson's disease and dystonia: lessons from transcranial magnetic stimulation? A review of the literature].Rev Neurol (Paris). 2005 Jan;161(1):27-41. doi: 10.1016/s0035-3787(05)84971-9. Rev Neurol (Paris). 2005. PMID: 15677999 Review. French.
Cited by
-
Targeting of the pedunculopontine nucleus by an MRI-guided approach: a cadaver study.J Neural Transm (Vienna). 2011 Oct;118(10):1487-95. doi: 10.1007/s00702-011-0639-0. Epub 2011 Apr 6. J Neural Transm (Vienna). 2011. PMID: 21484277
-
Transient and state modulation of beta power in human subthalamic nucleus during speech production and finger movement.Neuroscience. 2012 Jan 27;202:218-33. doi: 10.1016/j.neuroscience.2011.11.072. Epub 2011 Dec 6. Neuroscience. 2012. PMID: 22173017 Free PMC article.
-
Functional Connectivity of the Pedunculopontine Nucleus and Surrounding Region in Parkinson's Disease.Cereb Cortex. 2017 Jan;27(1):54-67. doi: 10.1093/cercor/bhw340. Epub 2016 Nov 22. Cereb Cortex. 2017. PMID: 28316456 Free PMC article.
-
Pallidostriatal Projections Promote β Oscillations in a Dopamine-Depleted Biophysical Network Model.J Neurosci. 2016 May 18;36(20):5556-71. doi: 10.1523/JNEUROSCI.0339-16.2016. J Neurosci. 2016. PMID: 27194335 Free PMC article.
-
Dual-Site Transcranial Magnetic Stimulation for the Treatment of Parkinson's Disease.Front Neurol. 2019 Mar 7;10:174. doi: 10.3389/fneur.2019.00174. eCollection 2019. Front Neurol. 2019. PMID: 30899243 Free PMC article.
References
-
- Androulidakis AG, Doyle LM, Gilbertson TP, Brown P. Corrective movements in response to displacements in visual feedback are more effective during periods of 13–35 Hz oscillatory synchrony in the human corticospinal system. Eur. J. Neurosci. 2006;24:3299–3304. - PubMed
-
- Androulidakis AG, Kühn AA, Chen CC, Blomstedt P, Kempf F, Kupsch A, Schneider G-H, Doyle L, Dowsey-Limousin P, Hariz MI, Brown P. Dopaminergic therapy promotes lateralized motor activity in the subthalamic area in Parkinson’s disease. Brain. 2007;130:457–468. - PubMed
-
- Brown P, Williams D. Basal ganglia local field potential activity: character and functional significance in the human. Clin. Neurophysiol. 2005;116:2510–2519. - PubMed
Publication types
MeSH terms
Grants and funding
LinkOut - more resources
Full Text Sources
