. 2009 Aug;13(8B):2534-2546.
doi: 10.1111/j.1582-4934.2008.00429.x. Epub 2008 Jul 23.

Interleukin 8 is differently expressed and modulated by PAR-1 activation in early and late endothelial progenitor cells

Affiliations

Interleukin 8 is differently expressed and modulated by PAR-1 activation in early and late endothelial progenitor cells

David M Smadja et al. J Cell Mol Med. 2009 Aug.

Abstract

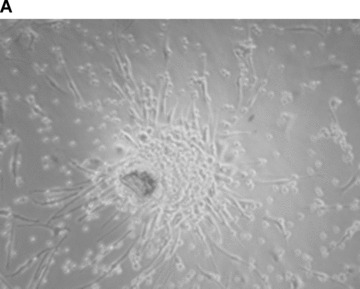
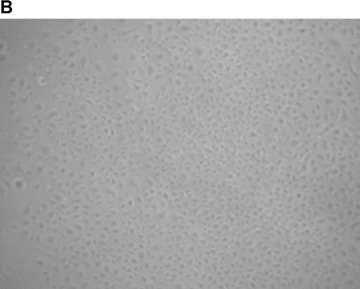
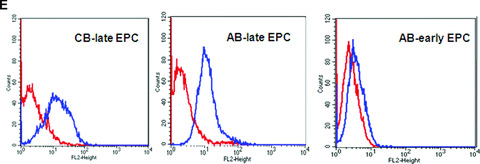
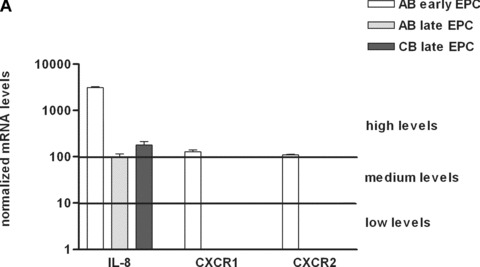
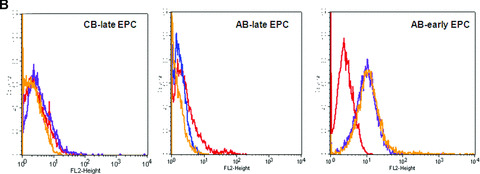
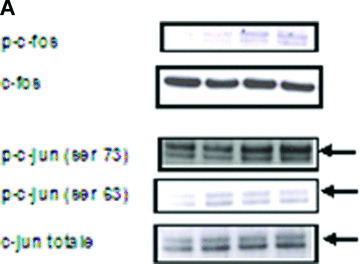
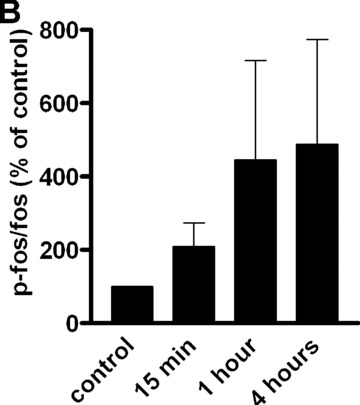
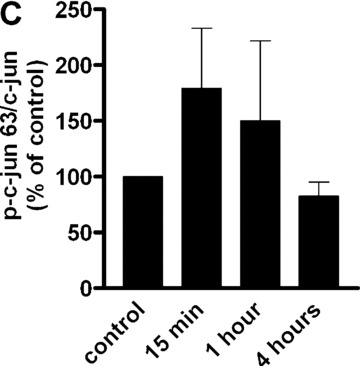
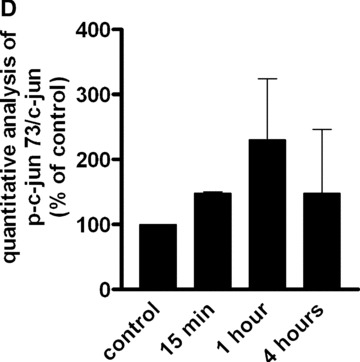
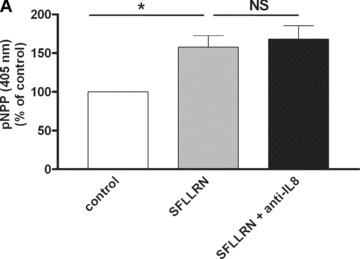
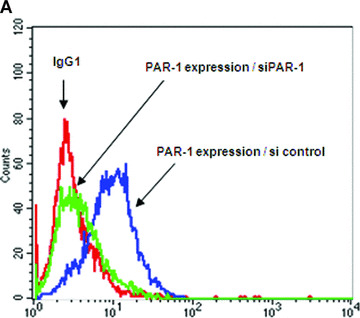
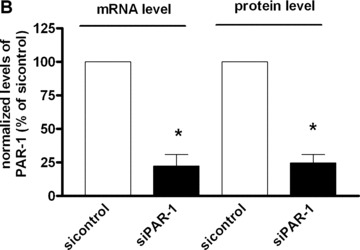
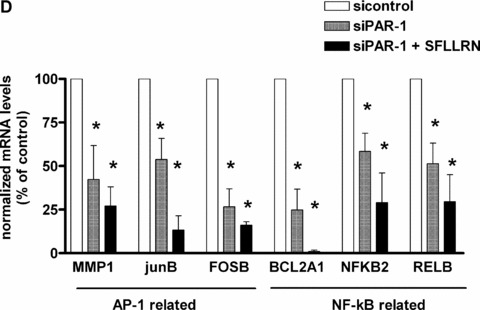
The proinflammatory chemokine interleukin 8 exerts potent angiogenic effects on endothelial cells by interacting with its receptors CXCR1 and CXCR2. As thrombin is also a potent inflammatory factor, and as endothelial progenitor cells (EPC) express functional PAR-1 thrombin receptor, we examined whether PAR-1 stimulation interferes with the IL-8 pathway in EPC. EPC were obtained from adult blood (AB) and cord blood (CB). The effect of PAR-1 stimulation by the peptide SFLLRN on IL-8, CXCR1 and CXCR2 expression was examined by RTQ-PCR and at the protein level in AB and CB late EPC and in AB early EPC. Specific siRNA was used to knock down PAR-1 expression. The IL-8 gene was expressed strongly in AB early EPC and moderately in late EPC. In contrast, CXCR1 and CXCR2 gene expression was restricted to AB early EPC. The IL-8 level in AB early EPC conditioned medium was high in basal conditions and did not change after PAR-1 activation. By contrast, IL-8 secretion by late EPC was low in basal conditions and strongly up-regulated upon PAR-1 activation. PAR-1 activation induced a number of genes involved in activating protein-1 (AP-1) and nuclear factor (NF)-kappaB pathways. Conditioned medium of PAR-1-activated late EPC enhanced the migratory potential of early EPC, and this effect was abrogated by blocking IL-8. Target-specific siRNA-induced PAR-1 knockdown, and fully inhibited PAR-1-induced IL-8 synthesis. In conclusion, PAR-1 activation induces IL-8 synthesis by late EPC. This could potentially enhance cooperation between late and early EPC during neovascularization, through a paracrine effect.


Figures

Figure 1
Figure 1
Characterization of early and late EPC. (A) Representative phase‐contrast photomicrograph of AB‐early EPC (mag. ×20). (B) Representative phase‐contrast photomicrograph of an AB‐late EPC colony (mag. ×20). (C) Growth curves of three types of EPC: early EPC isolated from adult blood (▪), and late EPC isolated from adult blood (–▴–) and cord blood (▾). (D) Ki‐67 differential expression between early EPC (left panel) and late EPC from adult blood (centre) and cord blood (right) by immunohistochemistry. Representative images of AB early EPC 10 days after plating and AB and CB late EPC before 40 days of culture after plating. (E) Expression of the thrombin receptor PAR‐1 in AB‐early, AB‐late and CB‐late EPC by flow cytometry. Representative histograms of detached EPC after immunolabelling with a control antibody (red line) and PAR‐1‐specific antibody (blue line).
Figure 1
Figure 1
Characterization of early and late EPC. (A) Representative phase‐contrast photomicrograph of AB‐early EPC (mag. ×20). (B) Representative phase‐contrast photomicrograph of an AB‐late EPC colony (mag. ×20). (C) Growth curves of three types of EPC: early EPC isolated from adult blood (▪), and late EPC isolated from adult blood (–▴–) and cord blood (▾). (D) Ki‐67 differential expression between early EPC (left panel) and late EPC from adult blood (centre) and cord blood (right) by immunohistochemistry. Representative images of AB early EPC 10 days after plating and AB and CB late EPC before 40 days of culture after plating. (E) Expression of the thrombin receptor PAR‐1 in AB‐early, AB‐late and CB‐late EPC by flow cytometry. Representative histograms of detached EPC after immunolabelling with a control antibody (red line) and PAR‐1‐specific antibody (blue line).
Figure 2
Figure 2
Expression of IL‐8 and its receptors CXCR1 and CXCR2 in early and late EPC. (A) Transcripts of IL‐8 and its receptors CXCR1 and CXCR2 were measured in early EPC isolated from adult blood, and in late EPC isolated from adult and cord blood. mRNA levels were normalized to TBP transcripts and to the sample with the lowest quantifiable level (i.e. 1 on the left ordinate, corresponding to a Ct value of 35). (B) Expression of CXCR1 and CXCR2 in AB early, AB late and CB late EPC by flow cytometry. Representative histograms of detached EPC after immunolabelling with a control antibody (red line) and specific antibodies against CXCR1 (blue line) and CXCR2 (orange line).
Figure 2
Figure 2
Expression of IL‐8 and its receptors CXCR1 and CXCR2 in early and late EPC. (A) Transcripts of IL‐8 and its receptors CXCR1 and CXCR2 were measured in early EPC isolated from adult blood, and in late EPC isolated from adult and cord blood. mRNA levels were normalized to TBP transcripts and to the sample with the lowest quantifiable level (i.e. 1 on the left ordinate, corresponding to a Ct value of 35). (B) Expression of CXCR1 and CXCR2 in AB early, AB late and CB late EPC by flow cytometry. Representative histograms of detached EPC after immunolabelling with a control antibody (red line) and specific antibodies against CXCR1 (blue line) and CXCR2 (orange line).
Figure 3
Figure 3
SFLLRN induces expression of IL‐8 mRNA and protein in late EPC. (A) Early and late EPC were cultured in endothelial basal medium‐2 (EBM2) for 24 hrs and IL‐8 was quantified in the medium by ELISA. IL‐8 (ng/106 cells) was at 312 ± 28 in early EPC and 338 ± 3 after SFLLRN treatment (P= 0.46). IL‐8 in late EPC from adult blood averaged 15 ± 2 ng/106 cells at baseline versus 273 ± 80 ng/106 cells after SFLLRN treatment (*P= 0.014). In late EPC from cord blood, IL‐8 was at 110 ± 7 ng/106 cells versus 471 ± 196 ng/106 cells after SFLLRN treatment (*P= 0.034). (B) Effect of PAR‐1 activation on mRNA expression of IL‐8 and its receptors CXCR1 and CXCR2 by early EPC from adult blood (AB) and late EPC from AB and cord blood (CB). Gene expression was considered relevant when the Ct value (representing the threshold cycle number at which PCR products become detectable) was below 35. EPC were stimulated with SFLLRN 75 μM for 4 hrs after 16 hrs of serum and growth‐factor privation (EBM2). mRNAs were measured by RTQ‐PCR and normalized to the ubiquitous gene TBP mRNA. Normalized mRNA levels were compared between stimulated and untreated control cells (arbitrarily = 1). Data are means ± S.E.M. of at least three independent experiments. (C) Time‐dependent fold‐increase in IL‐8 gene expression upon PAR‐1 activation by SFLLRN in CB late EPC. Serum‐starved CB late EPC were kept unstimulated or stimulated for 1, 4, 8, 12, 24 or 48 hrs with SFLLRN 75 μM. MRNAs were measured by RTQ‐PCR and normalized to the ubiquitous gene TBP mRNA. Normalized mRNA levels were compared between stimulated and untreated control cells (arbitrarily = 1). Data are means ± S.E.M. of at least three independent experiments.
Figure 3
Figure 3
SFLLRN induces expression of IL‐8 mRNA and protein in late EPC. (A) Early and late EPC were cultured in endothelial basal medium‐2 (EBM2) for 24 hrs and IL‐8 was quantified in the medium by ELISA. IL‐8 (ng/106 cells) was at 312 ± 28 in early EPC and 338 ± 3 after SFLLRN treatment (P= 0.46). IL‐8 in late EPC from adult blood averaged 15 ± 2 ng/106 cells at baseline versus 273 ± 80 ng/106 cells after SFLLRN treatment (*P= 0.014). In late EPC from cord blood, IL‐8 was at 110 ± 7 ng/106 cells versus 471 ± 196 ng/106 cells after SFLLRN treatment (*P= 0.034). (B) Effect of PAR‐1 activation on mRNA expression of IL‐8 and its receptors CXCR1 and CXCR2 by early EPC from adult blood (AB) and late EPC from AB and cord blood (CB). Gene expression was considered relevant when the Ct value (representing the threshold cycle number at which PCR products become detectable) was below 35. EPC were stimulated with SFLLRN 75 μM for 4 hrs after 16 hrs of serum and growth‐factor privation (EBM2). mRNAs were measured by RTQ‐PCR and normalized to the ubiquitous gene TBP mRNA. Normalized mRNA levels were compared between stimulated and untreated control cells (arbitrarily = 1). Data are means ± S.E.M. of at least three independent experiments. (C) Time‐dependent fold‐increase in IL‐8 gene expression upon PAR‐1 activation by SFLLRN in CB late EPC. Serum‐starved CB late EPC were kept unstimulated or stimulated for 1, 4, 8, 12, 24 or 48 hrs with SFLLRN 75 μM. MRNAs were measured by RTQ‐PCR and normalized to the ubiquitous gene TBP mRNA. Normalized mRNA levels were compared between stimulated and untreated control cells (arbitrarily = 1). Data are means ± S.E.M. of at least three independent experiments.
Figure 4
Figure 4
Effect of SFLLRN 75 μM on c‐Fos (Thr325) and c‐jun (Ser 63 and Ser73) phosphorylation. (A) CB late EPC were stimulated with SFLLRN 75 μM and collected 15 min., 1 hr and 4 hrs later for immunoblotting experiments. (B), (C) and (D): quantitative integration of western blots by image J® software for p‐fos (B) and p‐c‐jun 63 (C) and 73 (D) at the different time‐points.
Figure 4
Figure 4
Effect of SFLLRN 75 μM on c‐Fos (Thr325) and c‐jun (Ser 63 and Ser73) phosphorylation. (A) CB late EPC were stimulated with SFLLRN 75 μM and collected 15 min., 1 hr and 4 hrs later for immunoblotting experiments. (B), (C) and (D): quantitative integration of western blots by image J® software for p‐fos (B) and p‐c‐jun 63 (C) and 73 (D) at the different time‐points.
Figure 5
Figure 5
IL‐8 blockade inhibits SFLLRN‐induced migration of early EPC but not their proliferation and differentiation. (A) The effect of SFLLRN 75 μM on CB late EPC proliferation was evaluated by measuring pNPP release at 405 nm in EBM2 medium (mean ± S.E.M.). An IL‐8 blocking antibody had no effect on cell proliferation. *P < 0.05. (B) Quantitative analysis of network length. EPC were stimulated with SFLLRN 75 μM for 4 hrs before being used in the tubule formation assay on Matrigel for 18 hrs, in the presence or absence of a polyclonal antibody against human IL‐8. IL‐8 blockade did not inhibit SFLLRN‐induced pseudotube formation. *P < 0.05. (C) Early‐EPC migration towards conditioned medium (CM) of late EPC activated with SFLLRN for 48 hrs. The control is represented by early‐EPC migration toward CM of untreated late EPC (100% migration). CM of late EPC after PAR‐1 activation enhanced the migration of early EPC. This effect was abrogated by a polyclonal antibody against human IL‐8. The mean and S.E.M. of three experiments are shown. *P < 0.05.
Figure 5
Figure 5
IL‐8 blockade inhibits SFLLRN‐induced migration of early EPC but not their proliferation and differentiation. (A) The effect of SFLLRN 75 μM on CB late EPC proliferation was evaluated by measuring pNPP release at 405 nm in EBM2 medium (mean ± S.E.M.). An IL‐8 blocking antibody had no effect on cell proliferation. *P < 0.05. (B) Quantitative analysis of network length. EPC were stimulated with SFLLRN 75 μM for 4 hrs before being used in the tubule formation assay on Matrigel for 18 hrs, in the presence or absence of a polyclonal antibody against human IL‐8. IL‐8 blockade did not inhibit SFLLRN‐induced pseudotube formation. *P < 0.05. (C) Early‐EPC migration towards conditioned medium (CM) of late EPC activated with SFLLRN for 48 hrs. The control is represented by early‐EPC migration toward CM of untreated late EPC (100% migration). CM of late EPC after PAR‐1 activation enhanced the migration of early EPC. This effect was abrogated by a polyclonal antibody against human IL‐8. The mean and S.E.M. of three experiments are shown. *P < 0.05.
Figure 6
Figure 6
PAR‐1 gene silencing by siRNA reverses SFFLRN‐induced IL‐8 synthesis. (A) Analysis of PAR‐1 expression by flow cytometry on CB late EPC, after 48 hrs of transfection with si control (all star negative control, Qiagen®) and siPAR‐1 (Santacruz Biotechnologies®) with Primefect® (LONZA). (B) Quantitative analysis of PAR‐1 mRNA by RTQ‐PCR and PAR‐1 protein by flow cytometry. The mean and S.E.M. of five experiments are shown. *P < 0.05. (C) Inhibition of IL‐8 expression in siPAR‐1 transfected cells in basal conditions and after SFLLRN 75 μM activation. The mean and S.E.M. of at least three experiments are shown. *P < 0.05. (D): Inhibition of AP‐1 and NF‐κB members expression in siPAR‐1 transfected cells in basal conditions and after SFLLRN 75 μM activation. The mean and S.E.M. of three experiments are shown. *P < 0.05
Figure 6
Figure 6
PAR‐1 gene silencing by siRNA reverses SFFLRN‐induced IL‐8 synthesis. (A) Analysis of PAR‐1 expression by flow cytometry on CB late EPC, after 48 hrs of transfection with si control (all star negative control, Qiagen®) and siPAR‐1 (Santacruz Biotechnologies®) with Primefect® (LONZA). (B) Quantitative analysis of PAR‐1 mRNA by RTQ‐PCR and PAR‐1 protein by flow cytometry. The mean and S.E.M. of five experiments are shown. *P < 0.05. (C) Inhibition of IL‐8 expression in siPAR‐1 transfected cells in basal conditions and after SFLLRN 75 μM activation. The mean and S.E.M. of at least three experiments are shown. *P < 0.05. (D): Inhibition of AP‐1 and NF‐κB members expression in siPAR‐1 transfected cells in basal conditions and after SFLLRN 75 μM activation. The mean and S.E.M. of three experiments are shown. *P < 0.05

Similar articles

Cited by

References

    1. Murphy PM, Baggiolini M, Charo IF, et al. International union of pharmacology. XXII. Nomenclature for chemokine receptors. Pharmacol Rev. 2000; 1: 145–76. - PubMed
    1. Li A, Dubey S, Varney ML, et al. IL‐8 directly enhanced endothelial cell survival, proliferation, and matrix metalloproteinases production and regulated angiogenesis. J Immunol. 2003; 6: 3369–76. - PubMed
    1. Arenberg DA, Kunkel SL, Polverini PJ, et al. Inhibition of interleukin‐8 reduces tumorigenesis of human non‐small cell lung cancer in SCID mice. J Clin Invest. 1996; 12: 2792–802. - PMC - PubMed
    1. Strieter RM, Kunkel SL, Elner VM, et al. Interleukin‐8. A corneal factor that induces neovascularization. Am J Pathol. 1992; 6: 1279–84. - PMC - PubMed
    1. Galffy G, Mohammed KA, Nasreen N, et al. Inhibition of interleukin‐8 reduces human malignant pleural mesothelioma propagation in nude mouse model. Oncol Res. 1999; 4: 187–94. - PubMed

Publication types