

Sleep evoked delta frequency responses show a linear decline in amplitude across the adult lifespan
- PMID: 18657881
- PMCID: PMC3607371
- DOI: 10.1016/j.neurobiolaging.2008.06.003
Sleep evoked delta frequency responses show a linear decline in amplitude across the adult lifespan
Abstract
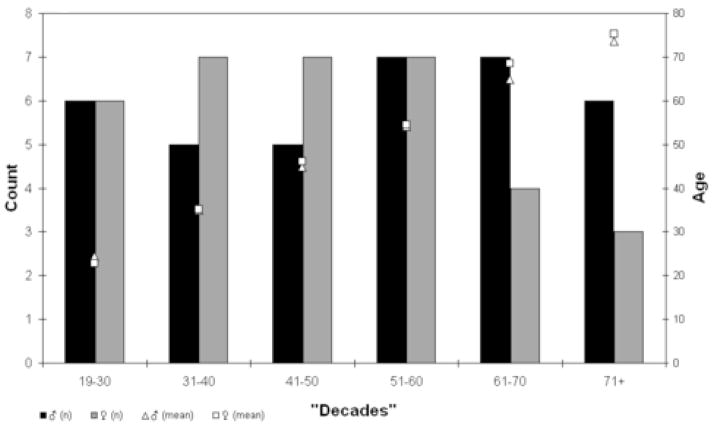
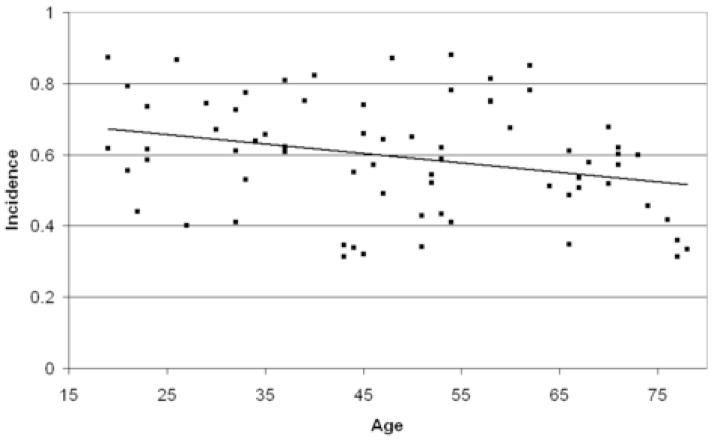
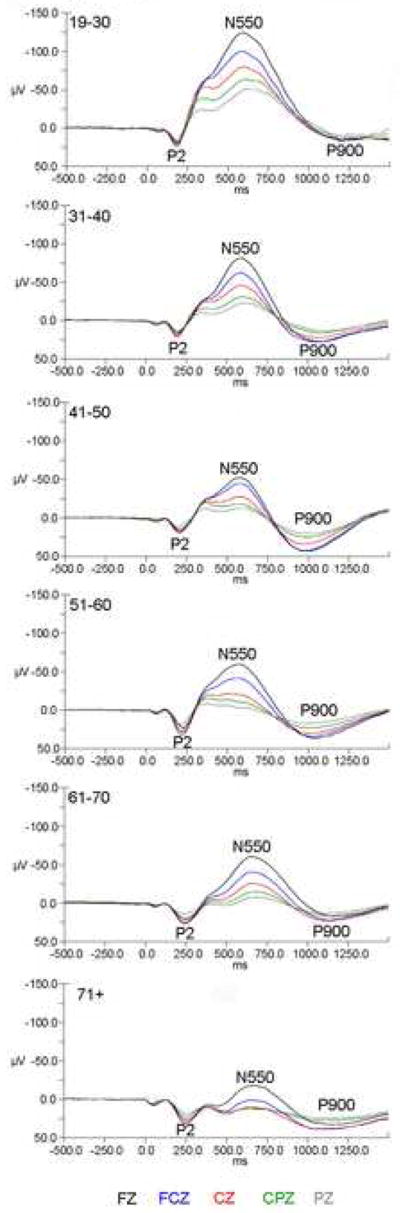
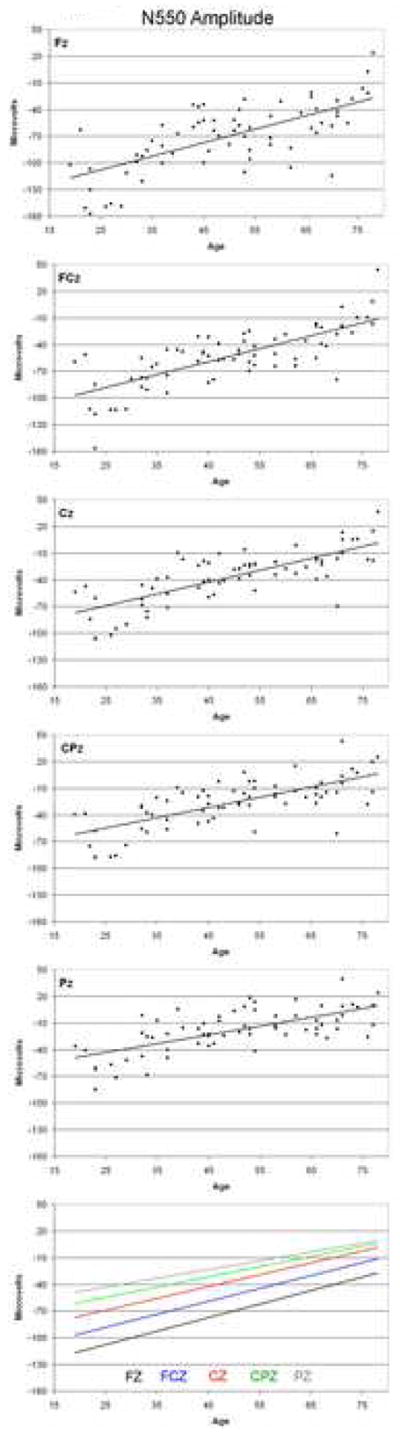
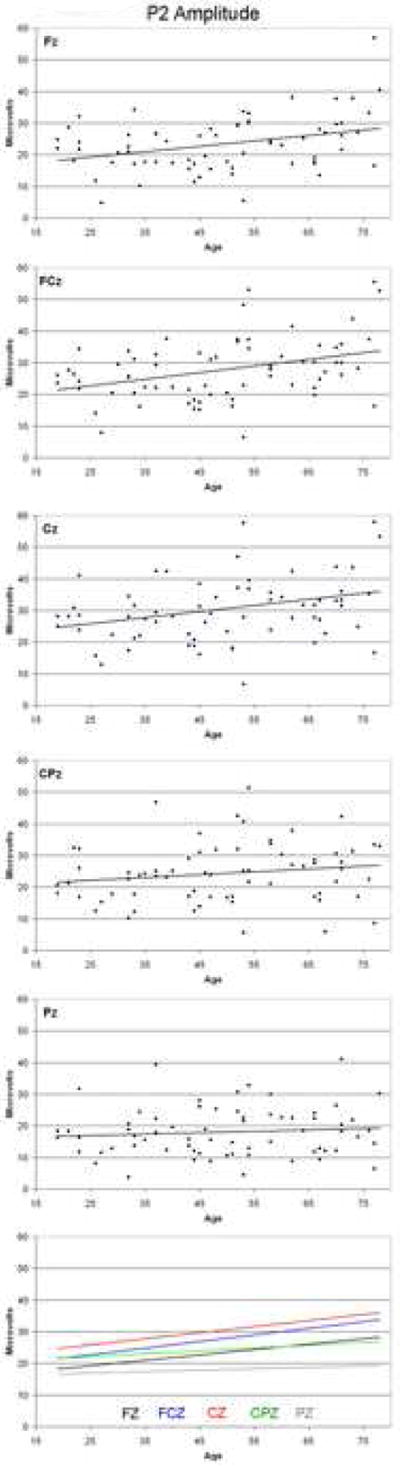
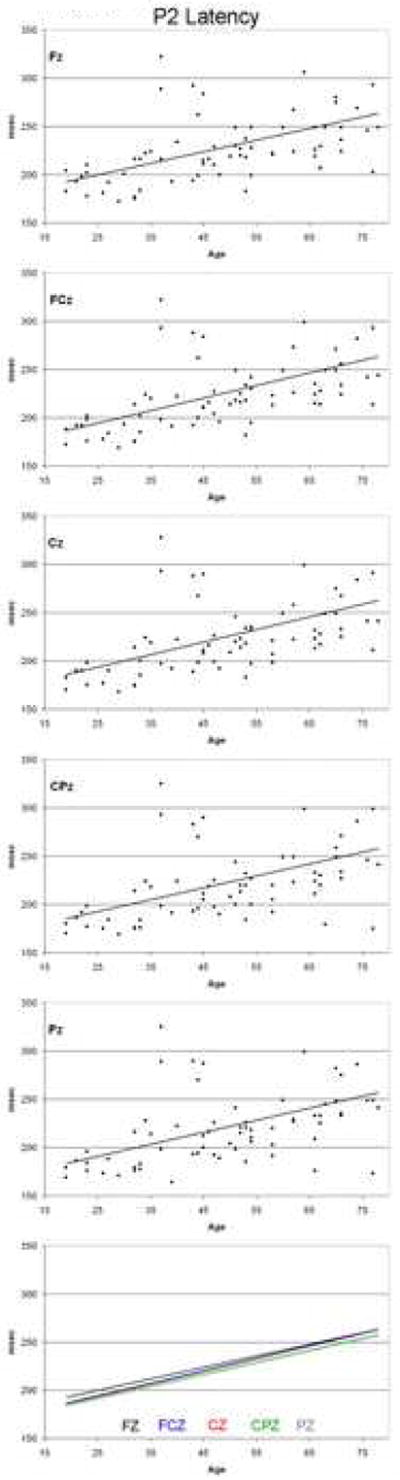
Aging is associated with many changes in sleep, with one of the most prominent being a reduction in slow wave sleep. Traditional measures of this phenomenon rely on spontaneous activity and typically confound the incidence and amplitude of delta waves. The measurement of evoked K-complexes during sleep, enable separate assessment of incidence and amplitude taken from the averaged K-complex waveform. The present study describes data from 70 normal healthy men and women aged between 19 and 78 years. K-Complexes were evoked using short auditory tones and recorded from a midline array of scalp sites. Significant reductions with age were seen in the amplitude of the N550 component of the averaged waveform, which represents the amplitude of the K-complex, with linear regression analysis indicating approximately 50% of the variance was due to age. Smaller, yet still significant reductions were seen in the ability to elicit K-complexes. The data highlight the utility of evoked K-complexes as a sensitive marker of brain aging in men and women.
(c) 2008 Elsevier Inc. All rights reserved.
Conflict of interest statement
Figures
Similar articles
-
The effects of alcoholism on auditory evoked potentials during sleep.J Sleep Res. 2002 Sep;11(3):247-53. doi: 10.1046/j.1365-2869.2002.00298.x. J Sleep Res. 2002. PMID: 12220321
-
The impact of alcoholism on sleep evoked Delta frequency responses.Biol Psychiatry. 2009 Jul 15;66(2):177-84. doi: 10.1016/j.biopsych.2008.10.010. Epub 2008 Dec 5. Biol Psychiatry. 2009. PMID: 19058790 Free PMC article.
-
An examination of evoked K-complex amplitude and frequency of occurrence in the elderly.J Sleep Res. 2002 Jun;11(2):129-40. doi: 10.1046/j.1365-2869.2002.00293.x. J Sleep Res. 2002. PMID: 12028478
-
Event-related potentials as a measure of sleep disturbance: a tutorial review.Noise Health. 2010 Apr-Jun;12(47):137-53. doi: 10.4103/1463-1741.63216. Noise Health. 2010. PMID: 20472959 Review.
-
The future of computer-assisted investigation of the polysomnogram: sleep microstructure.J Clin Neurophysiol. 1996 Jul;13(4):285-94. doi: 10.1097/00004691-199607000-00003. J Clin Neurophysiol. 1996. PMID: 8858491 Review.
Cited by
-
Alcohol use disorder and sleep disturbances: a feed-forward allostatic framework.Neuropsychopharmacology. 2020 Jan;45(1):141-165. doi: 10.1038/s41386-019-0446-0. Epub 2019 Jun 24. Neuropsychopharmacology. 2020. PMID: 31234199 Free PMC article. Review.
-
In Search of Sleep Biomarkers of Alzheimer's Disease: K-Complexes Do Not Discriminate between Patients with Mild Cognitive Impairment and Healthy Controls.Brain Sci. 2017 Apr 29;7(5):51. doi: 10.3390/brainsci7050051. Brain Sci. 2017. PMID: 28468235 Free PMC article.
-
Sleep and Motor Learning: Implications for Physical Rehabilitation After Stroke.Front Neurol. 2015 Nov 24;6:241. doi: 10.3389/fneur.2015.00241. eCollection 2015. Front Neurol. 2015. PMID: 26635718 Free PMC article. Review.
-
Effects of Aging on Cortical Neural Dynamics and Local Sleep Homeostasis in Mice.J Neurosci. 2018 Apr 18;38(16):3911-3928. doi: 10.1523/JNEUROSCI.2513-17.2018. Epub 2018 Mar 26. J Neurosci. 2018. PMID: 29581380 Free PMC article.
-
Transient decoupling of cortical EEGs following arousals during NREM sleep in middle-aged and elderly women.Int J Psychophysiol. 2010 Aug;77(2):71-82. doi: 10.1016/j.ijpsycho.2010.04.007. Epub 2010 May 5. Int J Psychophysiol. 2010. PMID: 20450941 Free PMC article.
References
-
- Achermann P, Borbely AA. Low-frequency (< 1 Hz) oscillations in the human sleep electroencephalogram. Neuroscience. 1997;81(1):213–222. - PubMed
-
- Afifi L, Guilleminault C, Colrain IM. Sleep and respiratory stimulus specific dampening of cortical responsiveness in OSAS. Respir Physiol Neurobiol. 2003;136(2–3):221–234. - PubMed
-
- Alonso A, Khateb A, Fort P, Jones BE, Muhlethaler M. Differential oscillatory properties of cholinergic and noncholinergic nucleus basalis neurons in guinea pig brain slice. Eur J Neurosci. 1996;8(1):169–182. - PubMed
-
- Amzica F, Massimini M. Glial and neuronal interactions during slow wave and paroxysmal activities in the neocortex. Cereb Cortex. 2002;12(10):1101–1113. - PubMed
Publication types
MeSH terms
Grants and funding
LinkOut - more resources
Full Text Sources
Medical
